Interactive Bokeh plots with JSCallbacks

Hi everyone,

I’m quite new to Python and Bokeh specifically, and while I started getting some hang of Bokeh I’ve hit the JS Callback wall, that I need to use if I want to keep having interactions embedded in independent HTML pages.

Basically my goal is to replicate something very similar to what this user did pretty neatly with Bokeh server, but wit JS Callbacks only:

Here is the link to the code he posted on Stackoverflow: Two interactive bokeh plots: select a value in one graph and change the other

Thank you in advance
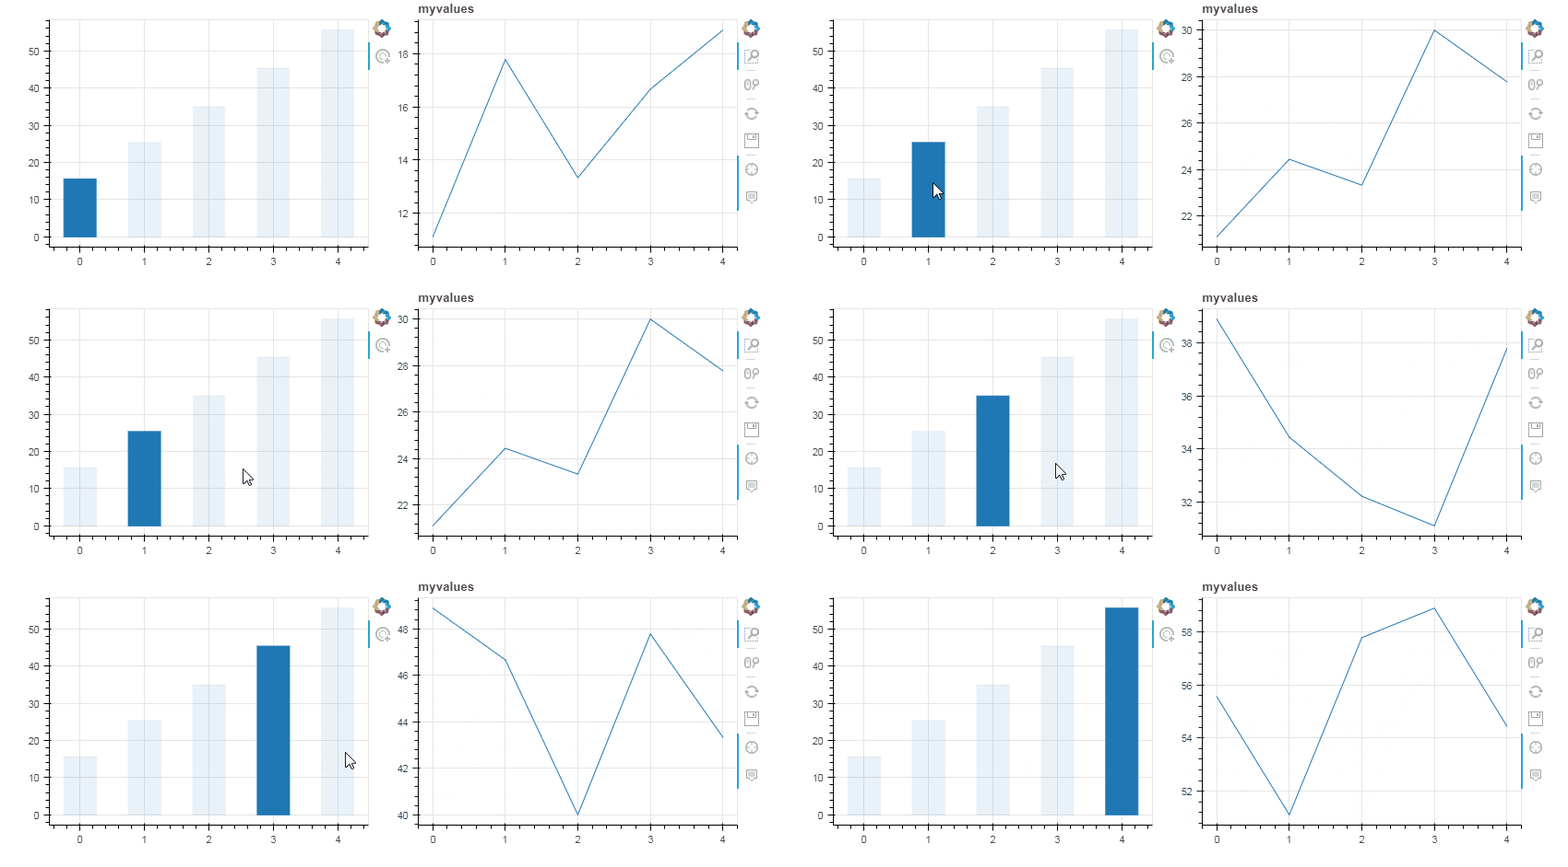
Maybe something like this (working for Bokeh 1.0.4):

import numpy as np
import pandas as pd
from bokeh.layouts import row
from bokeh.models import ColumnDataSource, CustomJS
from bokeh.plotting import figure, curdoc, show

df_main = pd.DataFrame({key: np.random.choice(30, 10) for key in [‘A’, ‘B’, ‘C’, ‘D’, ‘E’]})
df_mean = np.mean(df_main)
source_bars = ColumnDataSource({‘x’: list(range(0, df_mean.shape[0])), ‘y’: list(df_mean.values), ‘colnames’: list(df_mean.index.values)})
sources = { key: ColumnDataSource({‘x’: list(df_main.index.values), ‘y’: list(df_main.iloc[:, index].values)}) for index, key in enumerate([‘A’, ‘B’, ‘C’, ‘D’, ‘E’]) }

plot1 = figure(tools = “tap”)
plot2 = figure()
bars = plot1.vbar(x = ‘x’, top = ‘y’, source = source_bars, bottom = 0, width = 0.5)
lines = plot2.line(x = ‘x’, y = ‘y’, source = sources[‘A’])

code = ‘’’ selected_index = ds_bars.selected[“1d”][“indices”][0]
patch_name = ds_bars.data[‘colnames’][selected_index]
lines.data_source.data[‘y’] = sources[patch_name].data[‘y’]
lines.data_source.change.emit() ‘’’

plots = row(plot1, plot2)
source_bars.selected.js_on_change(‘indices’, CustomJS(args = {‘ds_bars’: source_bars, ‘lines’: lines, ‘sources’: sources}, code = code))
curdoc().add_root(plots)
show(plots)

``

···

On Friday, February 22, 2019 at 3:58:08 PM UTC+1, ARPAD ANDRASSY wrote:

Hi everyone,

I’m quite new to Python and Bokeh specifically, and while I started getting some hang of Bokeh I’ve hit the JS Callback wall, that I need to use if I want to keep having interactions embedded in independent HTML pages.

Basically my goal is to replicate something very similar to what this user did pretty neatly with Bokeh server, but wit JS Callbacks only:

Here is the link to the code he posted on Stackoverflow: Two interactive bokeh plots: select a value in one graph and change the other

Thank you in advance
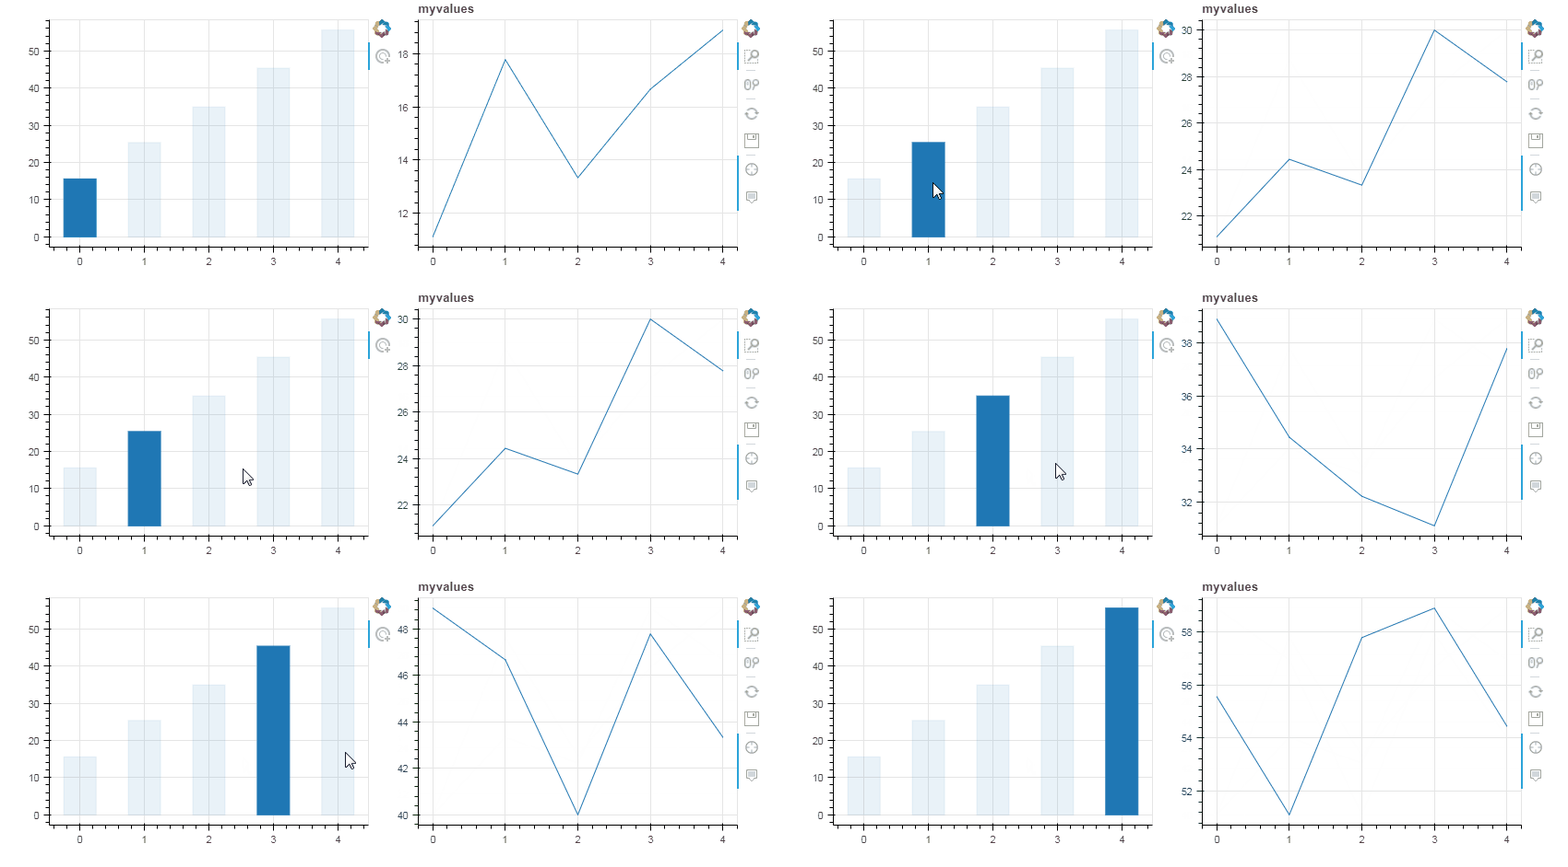
That’s it, works like a charm! Thank you very much Tony!

···

On Friday, February 22, 2019 at 4:58:08 PM UTC+2, ARPAD ANDRASSY wrote:

Hi everyone,

I’m quite new to Python and Bokeh specifically, and while I started getting some hang of Bokeh I’ve hit the JS Callback wall, that I need to use if I want to keep having interactions embedded in independent HTML pages.

Basically my goal is to replicate something very similar to what this user did pretty neatly with Bokeh server, but wit JS Callbacks only:

Here is the link to the code he posted on Stackoverflow: Two interactive bokeh plots: select a value in one graph and change the other

Thank you in advance

You are welcome.
One improvement for cases when you hit canvas aside a bar (otherwise it gives JS error) :

code = ‘’’ selected_index = ds_bars.selected[“1d”][“indices”][0]
if (selected_index != null){
patch_name = ds_bars.data[‘colnames’][selected_index]

             lines.data_source.data['y'] = sources[patch_name].data['y']

             lines.data_source.change.emit() }'''

``

···

On Friday, February 22, 2019 at 10:53:29 PM UTC+1, ARPAD ANDRASSY wrote:

That’s it, works like a charm! Thank you very much Tony!

On Friday, February 22, 2019 at 4:58:08 PM UTC+2, ARPAD ANDRASSY wrote:

Hi everyone,

I’m quite new to Python and Bokeh specifically, and while I started getting some hang of Bokeh I’ve hit the JS Callback wall, that I need to use if I want to keep having interactions embedded in independent HTML pages.

Basically my goal is to replicate something very similar to what this user did pretty neatly with Bokeh server, but wit JS Callbacks only:

Here is the link to the code he posted on Stackoverflow: Two interactive bokeh plots: select a value in one graph and change the other

Thank you in advance

Thanks again!

···

On Saturday, February 23, 2019 at 11:11:30 AM UTC+2, tony halik wrote:

You are welcome.
One improvement for cases when you hit canvas aside a bar (otherwise it gives JS error) :

code = ‘’’ selected_index = ds_bars.selected[“1d”][“indices”][0]
if (selected_index != null){
patch_name = ds_bars.data[‘colnames’][selected_index]

             lines.data_source.data['y'] = sources[patch_name].data['y']
             lines.data_source.change.emit() }'''

``

On Friday, February 22, 2019 at 10:53:29 PM UTC+1, ARPAD ANDRASSY wrote:

That’s it, works like a charm! Thank you very much Tony!

On Friday, February 22, 2019 at 4:58:08 PM UTC+2, ARPAD ANDRASSY wrote:

Hi everyone,

I’m quite new to Python and Bokeh specifically, and while I started getting some hang of Bokeh I’ve hit the JS Callback wall, that I need to use if I want to keep having interactions embedded in independent HTML pages.

Basically my goal is to replicate something very similar to what this user did pretty neatly with Bokeh server, but wit JS Callbacks only:

Here is the link to the code he posted on Stackoverflow: Two interactive bokeh plots: select a value in one graph and change the other

Thank you in advance

Thanks again!

You are welcome.
One improvement for cases when you hit canvas aside a bar (otherwise it gives JS error) :

code = ‘’’ selected_index = ds_bars.selected[“1d”][“indices”][0]
if (selected_index != null){
patch_name = ds_bars.data[‘colnames’][selected_index]

             lines.data_source.data['y'] = sources[patch_name].data['y']
             lines.data_source.change.emit() }'''

``

That’s it, works like a charm! Thank you very much Tony!

Hi everyone,

I’m quite new to Python and Bokeh specifically, and while I started getting some hang of Bokeh I’ve hit the JS Callback wall, that I need to use if I want to keep having interactions embedded in independent HTML pages.

Basically my goal is to replicate something very similar to what this user did pretty neatly with Bokeh server, but wit JS Callbacks only:

Here is the link to the code he posted on Stackoverflow: Two interactive bokeh plots: select a value in one graph and change the other

Thank you in advance

···

On Saturday, February 23, 2019 at 2:15:25 PM UTC+2, ARPAD ANDRASSY wrote:

On Saturday, February 23, 2019 at 11:11:30 AM UTC+2, tony halik wrote:

On Friday, February 22, 2019 at 10:53:29 PM UTC+1, ARPAD ANDRASSY wrote:

On Friday, February 22, 2019 at 4:58:08 PM UTC+2, ARPAD ANDRASSY wrote: