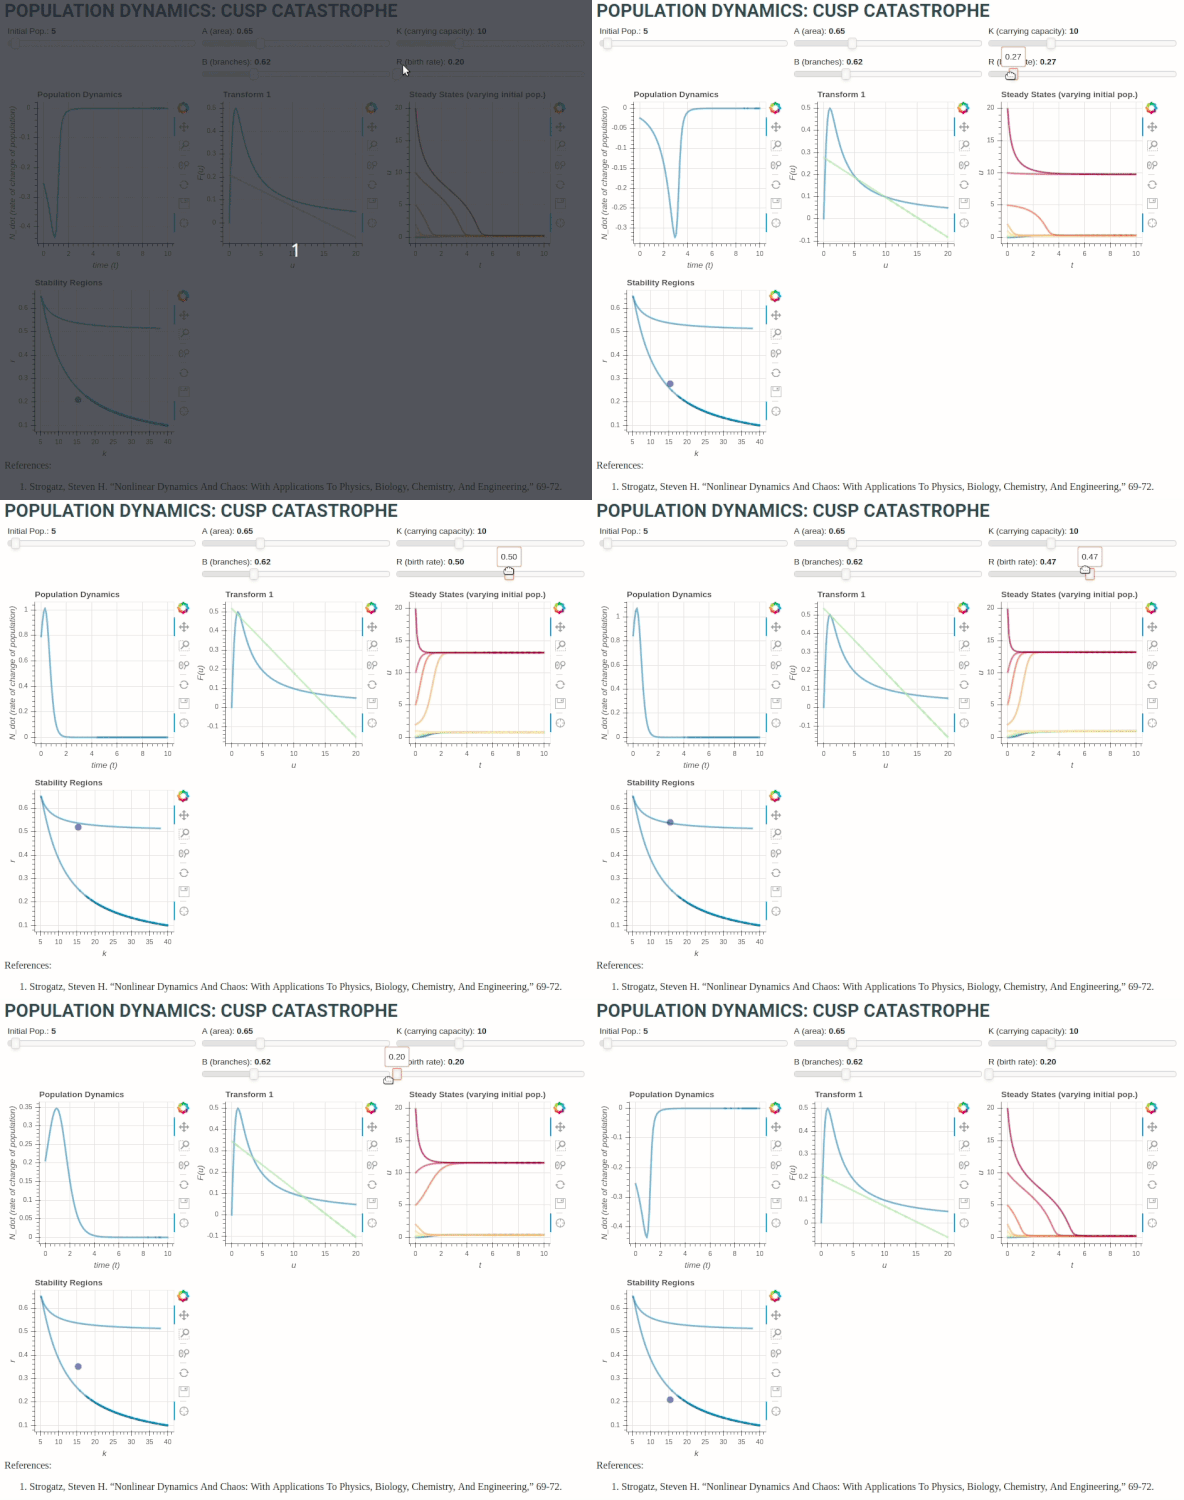
This summer I’m making my way through the lecture videos for Nonlinear Dynamics and Chaos taught by Steven Strogatz. In the textbook, there is a challenge in Section 3.7 to plot the nonlinear system representing an insect outbreak in its parameterized form as a 3d surface. The system is known as a ‘cusp catastrophe’, and in a more general sense, I think it represents systems exhibiting hysteresis that have a ‘bistable region’, which means the system will approach different stable states depending upon the initial state (and maybe also the perturbation?).
The system is represented by the following:
\dot{N} = RN\left(1-\frac{N}{K} \right) - \frac{BN^2}{A^2 +N^2}
Where:
- N is the population size
- R is growth rate
- K is the carrying capacity
- (A,B>0) are constants related to thresholds governing predation behaviour (I don’t think I’ve named the sliders correctly in this case.)
While the surface is interesting to see, I really like creating linked plots to demonstrate system behaviour based on changes to input parameters:
The plot at top-left shows the rate of change of budworm population with time. Centre-top is a dimensionless transform to illustrate fixed points graphically (i.e. when LHS = RHS):
r\left( 1 - \frac{x}{k} \right) = \frac{x}{1+x^2}
The plot at top right illustrates the system approaching the stable fixed points over time for different initial conditions (varying initial population size), and shows the creation and destruction of fixed points corresponding to the number of times the line r\left( 1 - \frac{x}{k} \right) intersects the curve \frac{x}{1+x^2} in the figure at top-middle.
Finally, the plot at bottom-left links the growth rate parameter to stable regions and number of fixed points. When the dot representing changing r crosses into the region between the curved lines, we see a new fixed point is created in the plot at top-right, and vice-versa.
This demo is available on Github.
Any feedback on content/style of this showcase post, style of code, repo README style, correctness of mathematical terminology or implementation, or really any constructive feedback is welcome.
Gotchas / Pointers:
As a starting point, I used the template from the gallery example sliders.py. It was really just plug-and-play after that. Most of my issues were with wrapping my head around the math, and the extent to which I wanted to make this interactive.
