Hello ![]() ,
,
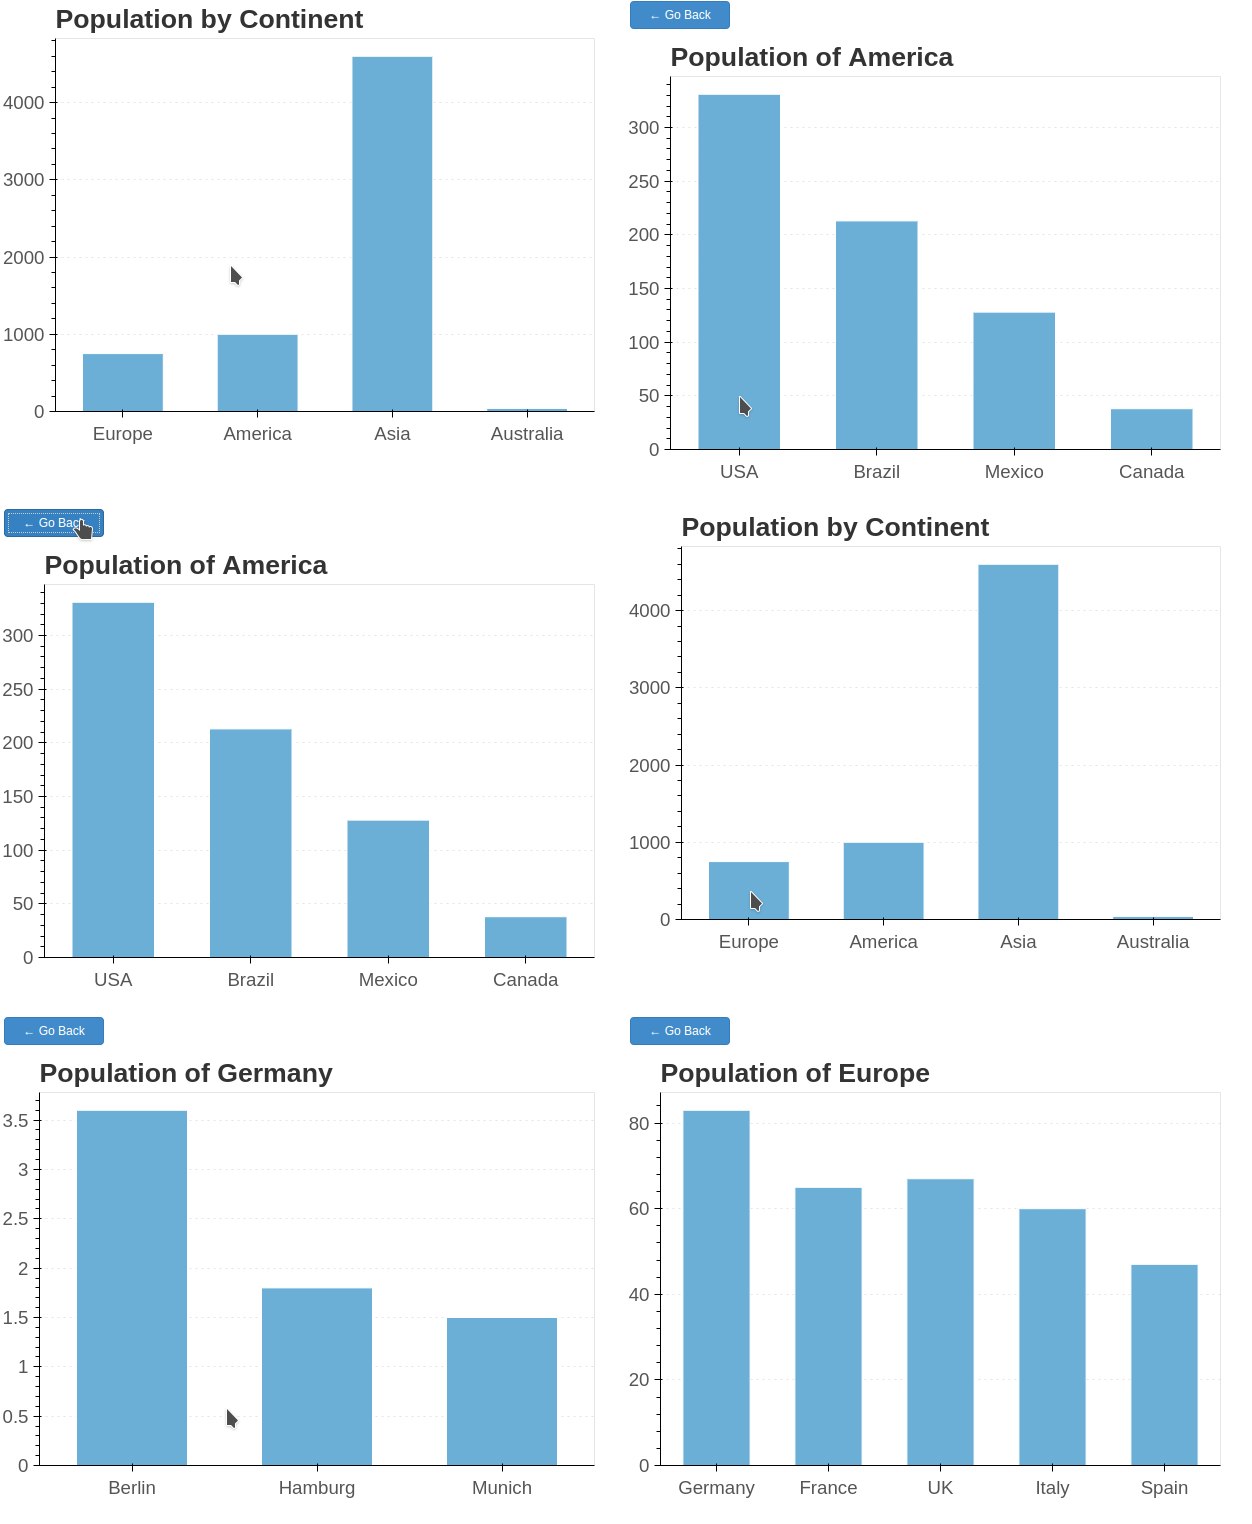
Here is an interactive bar chart using Bokeh where you can drill down from continents to countries and then to cities. You can explore the data by clicking and easily go back anytime with a simple button!

# drilldown_app.py
from bokeh.io import curdoc
from bokeh.models import ColumnDataSource, Button
from bokeh.plotting import figure
from bokeh.layouts import column, row
from bokeh.themes import Theme

# ======= Data =========

# Top-level continents
continents = ['Europe', 'America', 'Asia', 'Australia']
continent_population = [750, 1000, 4600, 40]  # in millions

# Second-level countries
continent_to_countries = {
    'Europe': (['Germany', 'France', 'UK', 'Italy', 'Spain'], [83, 65, 67, 60, 47]),
    'America': (['USA', 'Brazil', 'Mexico', 'Canada'], [331, 213, 128, 38]),
    'Asia': (['China', 'India', 'Japan', 'Indonesia'], [1440, 1390, 126, 276]),
    'Australia': (['Australia'], [26]),
}

# Third-level cities
country_to_cities = {
    'Germany': (['Berlin', 'Hamburg', 'Munich'], [3.6, 1.8, 1.5]),
    'France': (['Paris', 'Marseille', 'Lyon'], [2.1, 0.9, 0.5]),
    'UK': (['London', 'Manchester', 'Birmingham'], [9.0, 0.5, 1.1]),
    'Italy': (['Rome', 'Milan', 'Naples'], [2.8, 1.4, 1.0]),
    'Spain': (['Madrid', 'Barcelona', 'Valencia'], [3.2, 1.6, 0.8]),
    'USA': (['New York', 'Los Angeles', 'Chicago'], [8.4, 4.0, 2.7]),
    'Brazil': (['Sao Paulo', 'Rio de Janeiro', 'Brasilia'], [12.3, 6.7, 3.1]),
    'Mexico': (['Mexico City', 'Guadalajara', 'Monterrey'], [9.2, 1.5, 1.1]),
    'Canada': (['Toronto', 'Vancouver', 'Montreal'], [2.9, 0.6, 1.7]),
    'China': (['Beijing', 'Shanghai', 'Guangzhou'], [21.5, 24.2, 15.3]),
    'India': (['Mumbai', 'Delhi', 'Bangalore'], [20.7, 32.0, 12.3]),
    'Japan': (['Tokyo', 'Osaka', 'Nagoya'], [37.4, 19.2, 9.5]),
    'Indonesia': (['Jakarta', 'Surabaya', 'Bandung'], [10.5, 2.8, 2.4]),
    'Australia': (['Sydney', 'Melbourne', 'Brisbane'], [5.3, 5.0, 2.5]),
}

# ======= State =========

source = ColumnDataSource(data=dict(x=continents, top=continent_population))

navigation_stack = []  # will store ['Continent', 'Country']

# ======= Plot =========

p = figure(
    x_range=continents,
    height=450,
    title="Population by Continent",
    tools="tap",
    toolbar_location=None,
)

bars = p.vbar(x='x', top='top', width=0.6, source=source,
              fill_color="#6baed6", line_color="white", hover_fill_color="#2171b5")

p.xgrid.grid_line_color = None
p.ygrid.grid_line_dash = 'dotted'
p.y_range.start = 0
p.title.text_font_size = '20pt'
p.xaxis.major_label_text_font_size = '14pt'
p.yaxis.major_label_text_font_size = '14pt'

bars.selection_glyph = None
bars.nonselection_glyph = bars.glyph

# ======= Buttons =========

back_button = Button(label="← Go Back", button_type="primary", width=100)
back_button.visible = False

# ======= Drill down logic =========

def drill_down(event):
    if not event.indices:
        return
    clicked = source.data['x'][event.indices[0]]

    if not navigation_stack:  # currently at Continent level
        countries, populations = continent_to_countries.get(clicked, ([], []))
        if countries:
            source.data = dict(x=countries, top=populations)
            p.x_range.factors = countries
            p.title.text = f"Population of {clicked}"
            navigation_stack.append(clicked)
            back_button.visible = True
    elif len(navigation_stack) == 1:  # currently at Country level
        cities, populations = country_to_cities.get(clicked, ([], []))
        if cities:
            source.data = dict(x=cities, top=populations)
            p.x_range.factors = cities
            p.title.text = f"Population of {clicked}"
            navigation_stack.append(clicked)

def go_back():
    if len(navigation_stack) == 2:
        # From City level back to Country level
        continent = navigation_stack[0]
        countries, populations = continent_to_countries.get(continent, ([], []))
        source.data = dict(x=countries, top=populations)
        p.x_range.factors = countries
        p.title.text = f"Population of {continent}"
        navigation_stack.pop()
    elif len(navigation_stack) == 1:
        # From Country level back to Continent level
        source.data = dict(x=continents, top=continent_population)
        p.x_range.factors = continents
        p.title.text = "Population by Continent"
        navigation_stack.pop()
        back_button.visible = False

bars.data_source.selected.on_change('indices', lambda attr, old, new: drill_down(bars.data_source.selected))
back_button.on_click(go_back)

# ======= Layout =========

layout = column(row(back_button), p, sizing_mode="scale_width")
curdoc().add_root(layout)
curdoc().title = "Multi-Level Drill Down Bar Chart"

# ======= Theme =========

curdoc().theme = Theme(json={
    'attrs': {
        'Figure': {
            'background_fill_color': '#f5f5f5',
            'border_fill_color': '#f5f5f5',
            'outline_line_color': '#ffffff'
        },
        'Axis': {
            'major_label_text_font_size': '12pt',
            'major_label_text_color': '#555555',
            'axis_label_text_color': '#555555'
        },
        'Title': {
            'text_color': '#333333'
        }
    }
})
run it:
bokeh serve --show drilldown_app.py