Interactive multi_line graph with checkbox widget to show/hide lines not generating graph. Is there a line limit?

I posted this to StackOverflow a few days ago and haven’t gotten any response at all, so I’m hoping you guys here can find where I’m going wrong. :slight_smile:. I do see something similar has been asked here before, but not quite my use case. Python Bokeh: Interactive multi_line graph with checkbox widget to show/hide lines not generating graph. Is there a line limit? - Stack Overflow

(Pasted from SO post)
I’m building an interactive multi_line graph where the user will select which lines are displayed based on a combination of two CheckBoxGroups and a RadioGroup. There are a total of 111 possible lines to generate, and up to half of them viewed at one time (although no user would actually want to do that). Visibility is changed with a corresponding alpha in the line_alpha parameter. I was having luck generating the lines with p.line in a loop for every parameter but could not get interaction working cleanly. I tried MultiLine but couldn’t use an array for line_alpha and couldn’t generate the graph, so now I am using multi_line. The array of alpha values is updating correctly with the widget interaction, but again the graph is not generating even when taking out the line_alpha parameter. Is there some limit to the amount of data that will be graphed at one time? Or, more likely, am I making a simple mistake in my code? I’ve been fiddling with this for days but can’t track down the issue. There are no errors showing in the console. Below is the relevant sections of code (I’ve trimmed out any data wrangling). Also keep in mind the column names (other than ‘time’) are not known until runtime, so I can’t rely on hard coding that.

class LineGraphSuite(object):

    def __init__(self, file):
        st = SetupTable(file)
        self.tableAndInfo = st.setup()

        self.player_group = CheckboxGroup(labels=PLAYER_LIST, active=[0])
        self.param_group = CheckboxGroup(labels=PARAM_LIST, active=[0])
        self.dimension_group = RadioGroup(labels=DIMENSION_LIST, active=0)
        self.player_group.on_change('active', self.update)
        self.param_group.on_change('active', self.update)
        self.dimension_group.on_change('active', self.update)

        self.alphaList = self.generateAlphaArray(["ball_linearVelocity2D"])
        self.src = self.generateLineGraphData() # self.src is a pandas dataframe
        self.drawLineGraph()
        self.controls = Column(self.player_group, self.param_group, self.dimension_group)
        self.layout = column(self.controls, self.p)

    def drawLineGraph(self):
        """Generates multi line graph with every parameter and array of alpha values."""
        # Initialize figure to add upon
        print("Drawing line graph.")
        self.p = figure(plot_width = 1300, plot_height = 400, title = "Test Line Chart")
        
        # Draw multi line graph and use alpha array to update visibility of lines
        arr = []
        for entry in self.src: arr.append('time')
        df = self.tableAndInfo[0]
        xs = df[arr]
        self.p.multi_line(xs=xs, ys=self.src, line_alpha=self.alphaList)

    def update(self, attr, old, new):
        """Called in widget change events. Updates alpha array based on selected checkbox and radio buttons."""
        param = self.param_group.labels[self.param_group.active]
        dimension = self.dimension_group.labels[self.dimension_group.active]
        players = [self.player_group.labels[i] for i in self.player_group.active]
        paramList = []
        for player in players:
            print("Update: ", player, param, dimension)
            paramList.append(self.createColumnName(player, param, dimension))
        self.alphaList = self.generateAlphaArray(paramList)

    def generateLineGraph(self):    
        """Creates graph on page""" 
        print("Generating graph on page")       
        curdoc().add_root(self.layout)

What generates beneath the widget panel:

Hi, there’s really both too much and too little information to comment effectively:

  • too much code and content that is not related to the issue
  • too little code to actually run and investigate directly

To help others help you, the best practice is to specifically a construct a complete Minimal Reproducible Example that is self-contained and runnable, but has nothing extraneous to muddy the waters.

Otherwise, from a glance all I can say is that it appears you are not actually updating your data source at any point. Updating the data source that drives a glyph is what cause the plot to re-render and change its appearance.

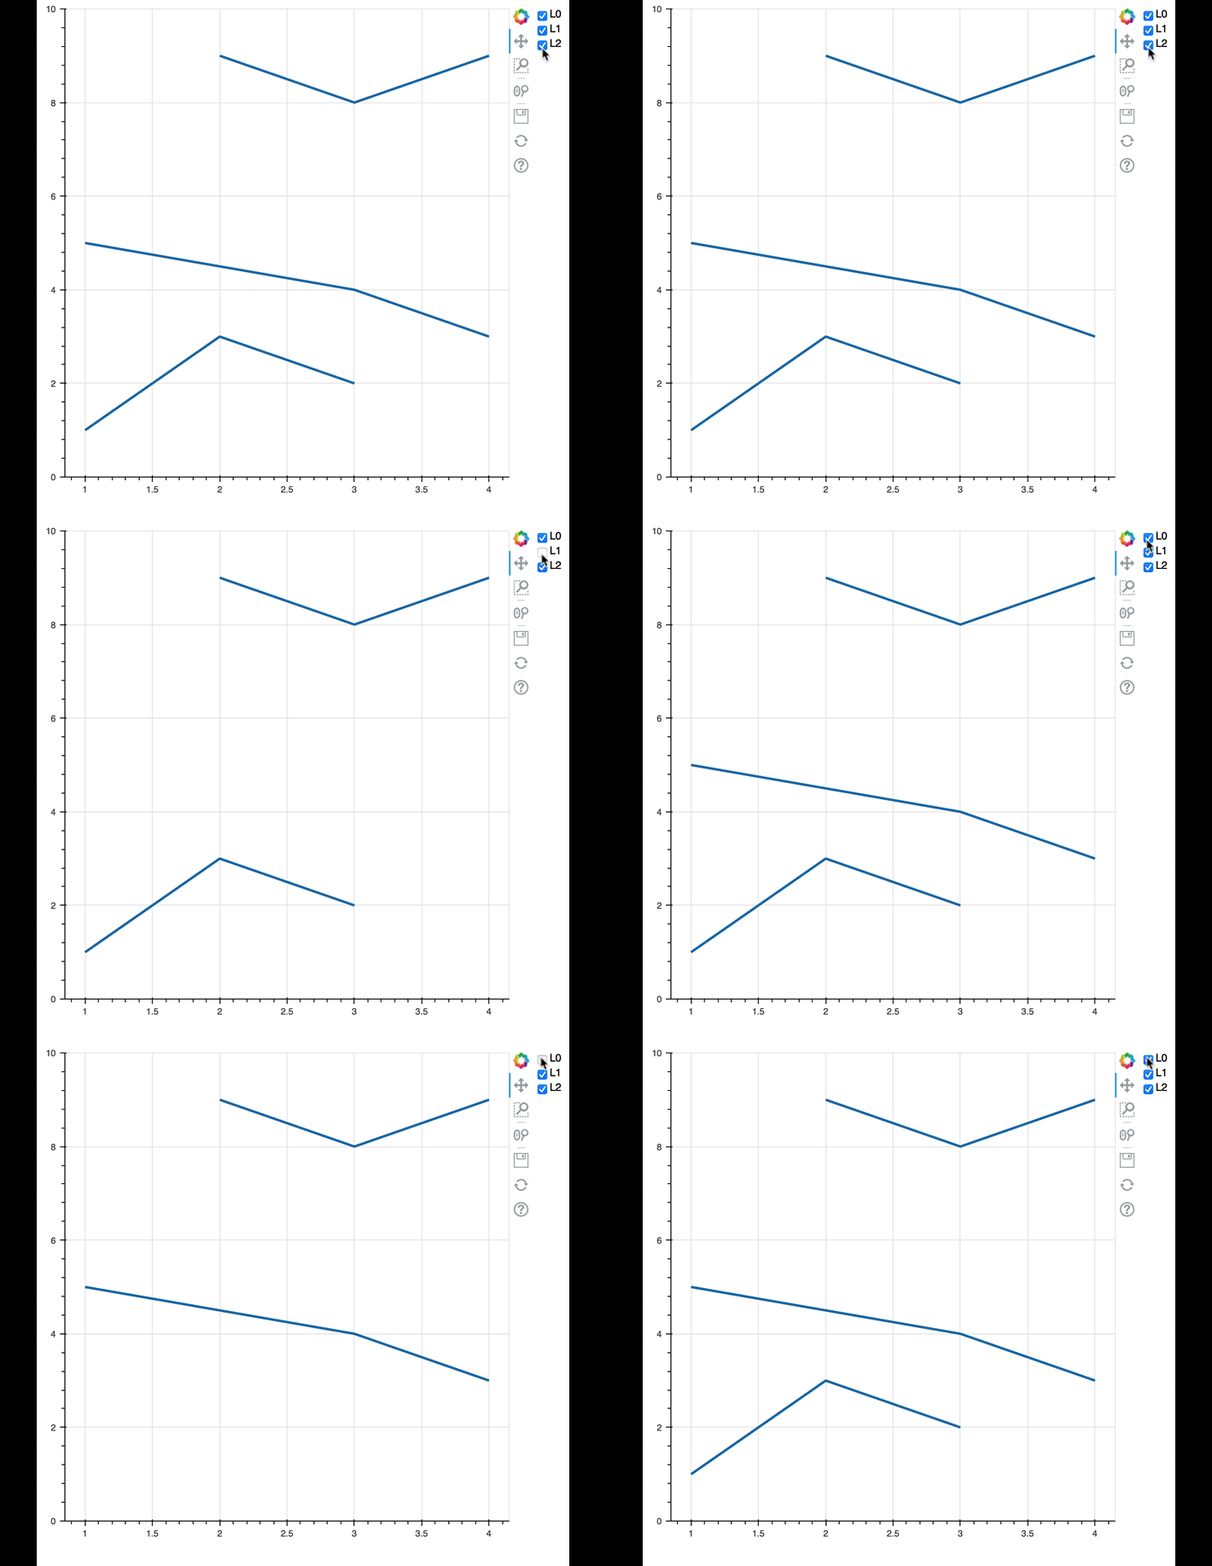
If I understand your ask, you want a checkbox that can modulate the individual alpha values of sub-lines in a multi-line glyph in order to “hide” and “show” them? Here is a minimal example that demonstrates that:

from bokeh.layouts import row
from bokeh.models import CheckboxGroup, ColumnDataSource
from bokeh.plotting import curdoc, figure

source = ColumnDataSource(data=dict(
    xs=[[1,2,3], [1,3,4], [2, 3, 4]],
    ys=[[1,3,2], [5,4,3], [9, 8, 9]],
    alpha=[1, 1, 1]
))

p = figure(y_range=(0, 10))
p.multi_line("xs", "ys", line_alpha="alpha", line_width=3, source=source)

cb = CheckboxGroup(labels=["L0", "L1", "L2"], active=[0, 1, 2])

def update(attr, old, new):
    # you'll have to supply logic to determine which indices to "show" and
    # which to "hide" based on checkbox according to your actual situation
    source.data["alpha"] = [int(i in cb.active) for i in range(len(cb.labels))]

checkbox.on_change('active', update)

curdoc().add_root(row(p, cb))

ScreenFlow

Also to answer the other question: There is no limit on the number of lines or points tho past a certain size (dependent on browser, network, etc), performance will certainly start to slow noticeably.

Hey Bryan, I really appreciate the help and the MVP of what I was trying to do. What I was doing wrong is, I didn’t realize that the alpha lives inside of the ColumnDataSource object, and I was providing it as a standalone array in the glyph. There was a silly mistake that I was making with converting the Pandas DF into the ColumnDataSource as well. It’s worth mentioning for anyone who stumbles on this thread in the future, if you’re converting a Pandas DF into a ColumnDataSource, make sure to convert xs and ys into individual lists of lists. I was passing each column as a series df[x], and that does not work. It needs to be df[x].tolist().

I will do better in the future about providing a standalone, self-contained example of my code.

2 Likes

Hello Bryan. Incidentally, do you have the same example but using on_change JS callbacks ? Thank you

I can help

from bokeh.layouts import row
from bokeh.models import CheckboxGroup, ColumnDataSource, CustomJS
from bokeh.plotting import curdoc, figure, show

source = ColumnDataSource(data=dict(
    ls = ['L0','L1','L2'],
    xs=[[1,2,3], [1,3,4], [2, 3, 4]],
    ys=[[1,3,2], [5,4,3], [9, 8, 9]],
    alpha=[1, 1, 1]
))

p = figure(y_range=(0, 10))
p.multi_line("xs", "ys", line_alpha="alpha", line_width=3, source=source)

cb = CheckboxGroup(labels=["L0", "L1", "L2"], active=[0, 1, 2])


update = CustomJS(args=dict(cb=cb,source=source)
                  ,code='''
                 
                 //get the labels corresponding to the active checkbox groups
                 //look up how JS map works
                 var active_lbls = cb.active.map(x=>cb.labels[x])
                 //then populate new array of alphas for the source based on this
                 var new_alphas = []
                 for (var i=0;i<source.data['ls'].length;i++){
                         if (active_lbls.includes(source.data['ls'][i])){
                                 new_alphas.push(1)
                                 }
                         else {new_alphas.push(0)}                         
                         }
                 //assign the new alphas
                 source.data['alpha'] = new_alphas
                 source.change.emit()
                 '''
                  )


cb.js_on_change('active', update)

show(row([p, cb]))

The key JS side things to utilize here are map, a for loop, an if statement, and Array.includes. If these things are all new/unfamiliar on the JS side to you (lord knows it was to me when I started learning this stuff), I’d recommend console.logging the crap out of the callback to see what’s happening, and also experimenting with dummy data on jsfiddle, codepen etc.

1 Like

Thank you @gmerritt123 I appreciated your prompt help to my both posts. I have just run your codes and they are working fine. I will check them in detail.
Preliminary, to use multi_line, I presume that I have to change my table, I will try it. Additionally I am not sure if the hover that I have currently will work also using the multi-line option.
I will keep you informed. Thank you very much again. Rodrigo

Incidentally, do you have an example using MultiChoice instead of CheckboxGroup?