On Dec 8, 2015, at 9:27 AM, Ingmar Nitze <[email protected]> wrote:
Hi Bryan,
thanks for the quick reply
The data update is triggered by a Click on a radio Button (line 324, lines 351 ff.) with the function below ( change_data_index() )
The ColumnDataSource.data gets completely overwritten/replaced with the same structure. In theory, only column 'y' gets overwritten, but practically the update (taken by the scatterplot) only works on overwriting .data entirely. (lines 431 ff.)
I guess there's something else that's also changing, which is linked to the hover, but not to other objects within the plot.
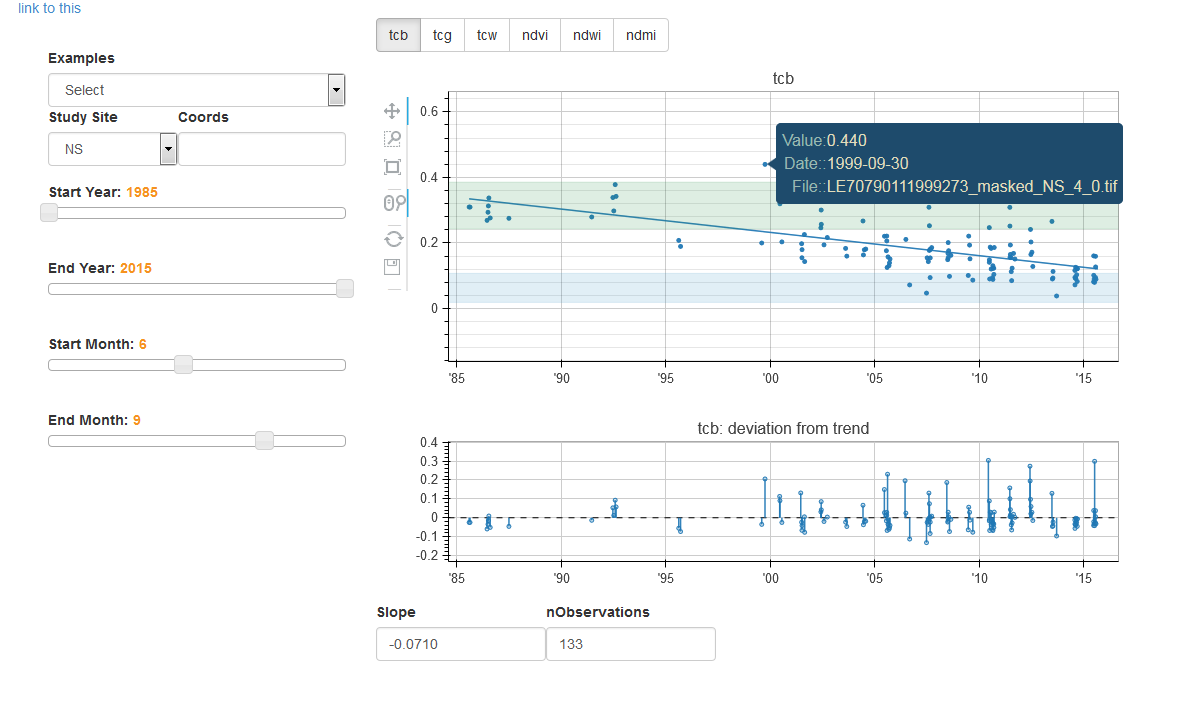
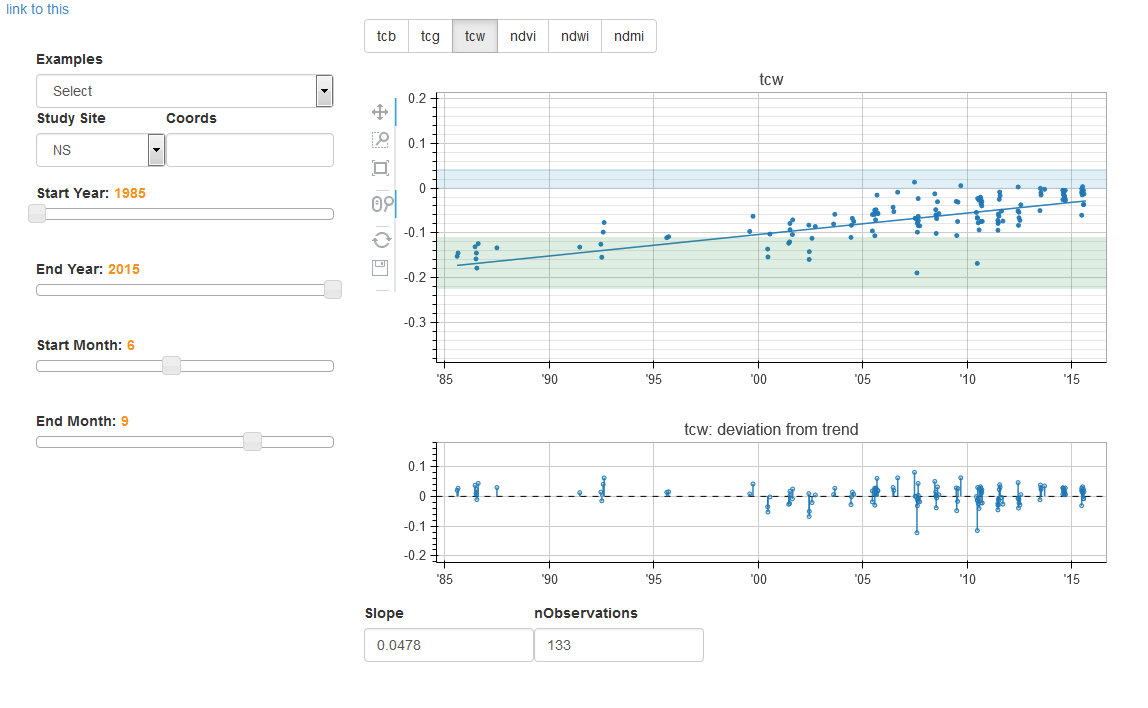
Weird enough, I am running the same data replacement strategy on Slider changes, where the Hover tools stays active (lines 469 ff.). It only disappears after data changes via RadioButton (see Figures).
Code and 2 Figures are attached
Thanks for your effort
lines 431 ff.
def change_data_index(self):
"""
Function changes the y-value according to the selected index from RadioButton Panel
Update of source data and background plots
:return:
"""
# update input-data - !!! only works for complete replacement of source dataset (Bug?) !!!
layer = self.radio_btns.labels[self.radio_btns.active]
y = np.array(self.source_base.data[layer], np.float32).copy()
...
self.source.data = dict(x=self.source.data['x'],
y=y,
y_mod=self.source.data['y_mod'],
yr=self.source.data['yr'],
mth=self.source.data['mth'],
dt=self.source.data['dt'],
y_mod_new=self.source.data['y_mod_new'],
y_diff=self.source.data['y_diff'],
datestr=self.source.data['datestr'],
flist=self.source.data['flist'])
<Auto Generated Inline Image 1.png>
<Auto Generated Inline Image 2.png>
On Tuesday, December 8, 2015 at 2:44:39 PM UTC+1, Bryan Van de ven wrote:
Hi Ingmar,
It's possible this is a bug, I'm not sure offhand. How exactly are you updating the data source? Can you provide more code? Ideally a minimal complete example that reproduces the issue will leave the best chance for debugger or offering advice.
Thanks,
Bryan
> On Dec 8, 2015, at 7:24 AM, Ingmar Nitze <[email protected]> wrote:
>
> Hi,
> I have an interactive scatterplot, running with a bokeh-server in the background, which is linked to a ColumnDatasource. There is a Hover Tool available, which shows some values of the dataset. The Hovertool is linked to the scatterplot via "names".
> At this stage, everything works as expected.
>
> The contents of the datasource can be changed interactively, loading another dataset, while clicking a button.
> After changing the input dataset (with the same column structure), the scatterplot gets updated. However, now the Hovertool seems to be inactive, showing no reaction anymore.
>
> Any idea for a solution? This issue has been a real headache for me so far.
> If you need more information, feel free to ask.
>
> Thanks in advance
> Ingmar
>
> self.plot.scatter(x='dt', y='y', source=self.source, alpha=0.3, name='scatter_active')
> ...
>
> hover = HoverTool(
> tooltips=[("Value", "@y{0.000}"),
> ("Date:", "@datestr"),
> ("File:","@flist"),
> ],
> line_policy="none",
> point_policy="snap_to_data",
> names = ['scatter_active'],
> name='hover_tool'
> )
> self.plot.add_tools(hover)
>
>
>
>
> --
> You received this message because you are subscribed to the Google Groups "Bokeh Discussion - Public" group.
> To unsubscribe from this group and stop receiving emails from it, send an email to bokeh+un...@continuum.io.
> To post to this group, send email to bo...@continuum.io.
> To view this discussion on the web visit https://groups.google.com/a/continuum.io/d/msgid/bokeh/002dea87-f979-4758-9248-3b2eb6ac67fe%40continuum.io\.
> For more options, visit https://groups.google.com/a/continuum.io/d/optout\.
--
You received this message because you are subscribed to the Google Groups "Bokeh Discussion - Public" group.
To unsubscribe from this group and stop receiving emails from it, send an email to [email protected].
To post to this group, send email to [email protected].
To view this discussion on the web visit https://groups.google.com/a/continuum.io/d/msgid/bokeh/d73d5afd-0328-4041-9c0f-2f150ff5efb2%40continuum.io\.
For more options, visit https://groups.google.com/a/continuum.io/d/optout\.
<sliders_app.py><Auto Generated Inline Image 1.png><Auto Generated Inline Image 2.png>