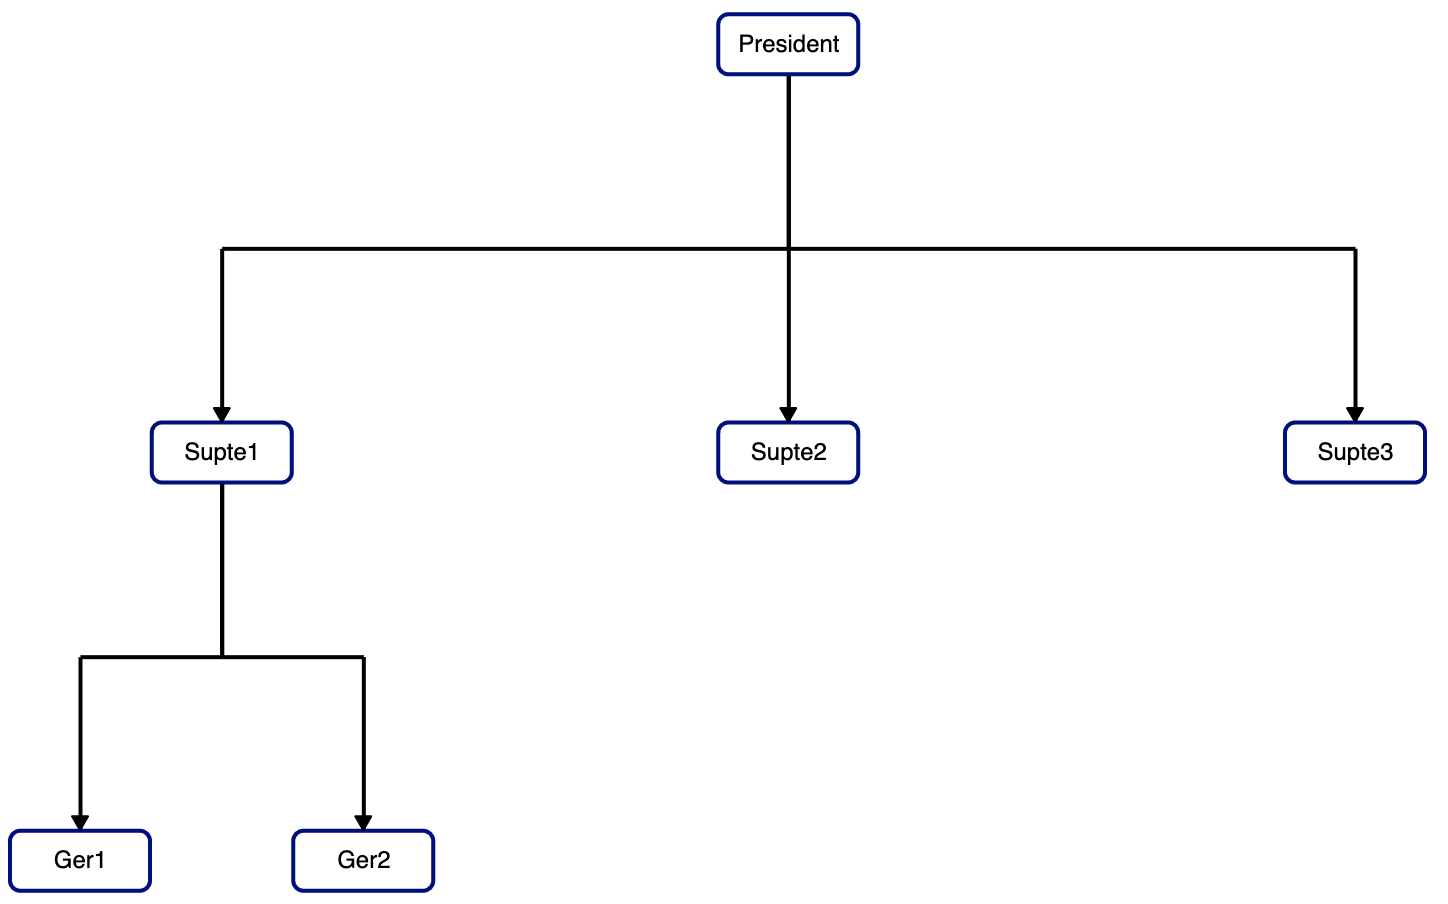
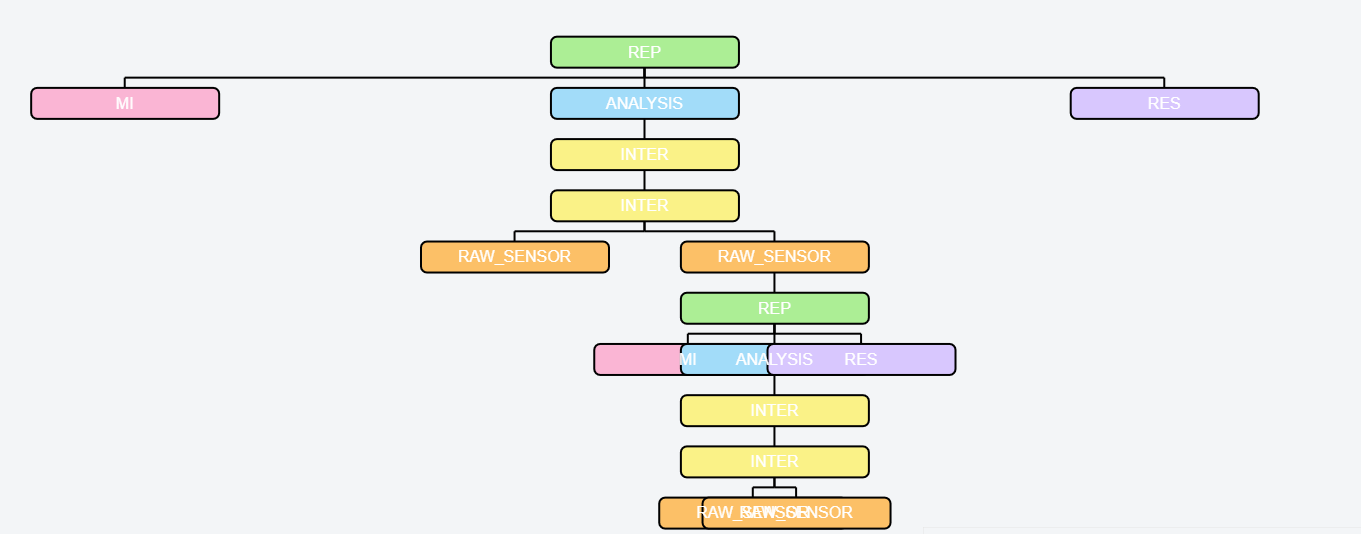
@CTPassion Here is one suggestion. I am using DiGraph in networkx to create a directed graph from a dataframe where I have defined the parent and child nodes. I use your function hierarchy_pos to get the positions (one can also use nx.nx_agraph.pygraphviz_layout but it requires some extra imports and graphviz installed).
I then use the edges and positions to calculate new edges and nodes that will give vertical and horizontal lines (can probably be optimized).
I have added the arrows using inverted_triangle; had to do a bit of calculations with respect to positioning the arrows since height of the boxes are in screen units. It also means that if you zoom the arrows will not stay at the correct location
I have added TapTool as a click callback event (JS).
Edit: add the following to have the arrows stay at correct location when zooming with mouse wheel:
from bokeh.events import MouseWheel
cb = CustomJS(
    args= {'source': src, 'plot': plot, 'yrng': plot.y_range},
    code = '''
    const canvas_dy = plot.inner_height;
    const rng_y0 = yrng.start;
    const rng_y1 = yrng.end;

    const y_offset = 20;
    const px_resol = (rng_y1-rng_y0)/canvas_dy;
    const data = source.data;
    for (let i=1; i < data['arrow_y'].length; i++) {
        data['arrow_y'][i] = data['y'][i] + y_offset*px_resol;
    }

    source.data = data;
    source.change.emit();
    ''')
plot.js_on_event(MouseWheel, cb)
import pandas as pd
import numpy as np
import networkx as nx
from bokeh.io import save, output_file
from bokeh.models import Circle, ColumnDataSource, MultiLine
from bokeh.models import HoverTool, TapTool, CustomJS
from bokeh.plotting import figure, from_networkx
output_file("plot_hierarchy.html")
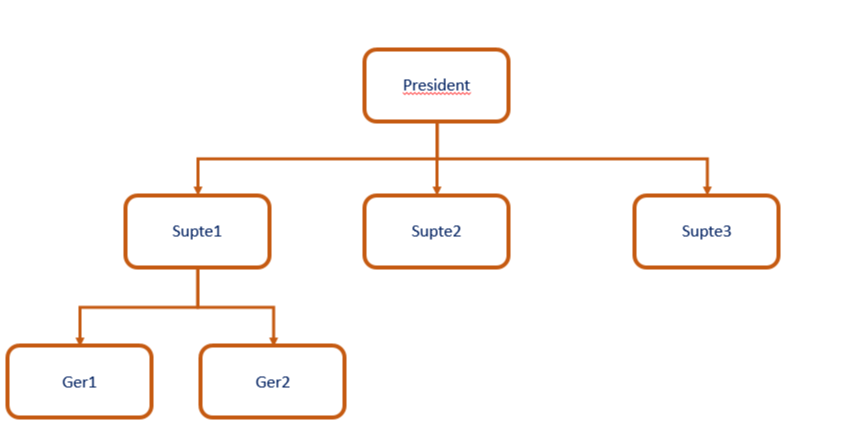
parent_childs = {
'President': ['Supte1', 'Supte2', 'Supte3'],
'Supte1': ['Ger1', 'Ger2']
}
levels = ['President', 'Supte1']
tree_df = pd.DataFrame(
[(l, c) for l in levels for c in parent_childs[l]],
columns = ['parent', 'child']
)
def hierarchy_pos(G, root=None, width=1., vert_gap = 0.2, vert_loc = 0, xcenter = 0.5):
'''
From Joel's answer at https://stackoverflow.com/a/29597209/2966723.
Licensed under Creative Commons Attribution-Share Alike
If the graph is a tree this will return the positions to plot this in a
hierarchical layout.
G: the graph (must be a tree)
root: the root node of current branch
- if the tree is directed and this is not given,
the root will be found and used
- if the tree is directed and this is given, then
the positions will be just for the descendants of this node.
- if the tree is undirected and not given,
then a random choice will be used.
width: horizontal space allocated for this branch - avoids overlap with other branches
vert_gap: gap between levels of hierarchy
vert_loc: vertical location of root
xcenter: horizontal location of root
'''
if not nx.is_tree(G):
raise TypeError('cannot use hierarchy_pos on a graph that is not a tree')
if root is None:
if isinstance(G, nx.DiGraph):
root = next(iter(nx.topological_sort(G))) #allows back compatibility with nx version 1.11
else:
root = random.choice(list(G.nodes))
def _hierarchy_pos(G, root, width=1., vert_gap = 0.2, vert_loc = 0, xcenter = 0.5, pos = None, parent = None):
'''
see hierarchy_pos docstring for most arguments
pos: a dict saying where all nodes go if they have been assigned
parent: parent of this branch. - only affects it if non-directed
'''
if pos is None:
pos = {root:(xcenter,vert_loc)}
else:
pos[root] = (xcenter, vert_loc)
children = list(G.neighbors(root))
if not isinstance(G, nx.DiGraph) and parent is not None:
children.remove(parent)
if len(children)!=0:
dx = width/len(children)
nextx = xcenter - width/2 - dx/2
for child in children:
nextx += dx
pos = _hierarchy_pos(G,child, width = dx, vert_gap = vert_gap,
vert_loc = vert_loc-vert_gap, xcenter=nextx,
pos=pos, parent = root)
return pos
return _hierarchy_pos(G, root, width, vert_gap, vert_loc, xcenter)
def horiz_vert_edges(G, pos):
'''
Calculate vertical and horizontal positions and create new edges
'''
new_pos = {}
new_edges = []
i = max(pos.keys())
for (n1, n2) in G.edges:
if pos[n1][0] == pos[n2][0]:
new_pos[n1] = pos[n1]
new_pos[n2] = pos[n2]
new_edges.append((n1, n2))
continue
i += 1
y = (pos[n1][1]+pos[n2][1])/2
new_edges.append((n1, i))
new_pos[n1] = pos[n1]
new_pos[i] = (pos[n1][0], y)
j = i + 1
new_edges.append((i, j))
new_pos[j] = (pos[n2][0], y)
new_pos[n2] = pos[n2]
new_edges.append((j, n2))
i += 1
return new_pos, new_edges
# Generate directed graph
G = nx.from_pandas_edgelist(
tree_df , 'parent', 'child', create_using = nx.DiGraph
)
#roots = [n for n,d in G.in_degree() if d==0]
#end_nodes = [x for x in G.nodes() if G.out_degree(x)==0 and G.in_degree(x)==1]
#print(G.edges)
#print(roots)
#print(end_nodes)
# Bokeh requires integer labels
G = nx.convert_node_labels_to_integers(G, label_attribute = 'node')
pos = hierarchy_pos(G)
# create new edges and positions for vertical and horizontal layout
new_pos, new_edges = horiz_vert_edges(G, pos)
# for drwaing layout use new edges and positions
GN = nx.DiGraph()
GN.add_edges_from(new_edges)
# create CDS for labels
df_cds = pd.DataFrame.from_dict(
pos, orient = 'index', columns = ['x','y']
).reset_index()
# screen/data units resolution from CustomJS.
# needed to position arrows at top of box, somewhat cumbersome
px_resol = (0.04+0.44)/490
node_int_mapping = {n: G.nodes[n]["node"] for n in pos}
df_cds['node'] = df_cds['index'].map(node_int_mapping)
df_cds['arrow_y'] = df_cds['y'] + 20*px_resol
df_cds.loc[df_cds['node'] == 'President', ['arrow_y']] = np.nan
src = ColumnDataSource(df_cds)
plot = figure(
width = 800,
height = 500,
tools = "pan,wheel_zoom,box_zoom,save,reset",
active_scroll = 'wheel_zoom'
)
plot.x_range.range_padding = 0.2
plot.y_range.range_padding = plot.x_range.range_padding
# create Bokeh network graph
network_graph = from_networkx(GN, new_pos)
# do not show automatic circles (size = 0)
network_graph.node_renderer.glyph = Circle(size=0, fill_color='skyblue')
#Set edge opacity and width
network_graph.edge_renderer.glyph = MultiLine(line_alpha=1, line_width=2)
#Add network graph to the plot
plot.renderers.append(network_graph)
# one issue with using a mix of screen and data units is that zooming
# ruins the layout.
# I have kept the box in screen units since the text is also in screen units
# But that means the arrows are not positioned correct when zooming.
r_rect = plot.rect(
x = 'x',
y = 'y',
width = 70,
width_units = 'screen',
height = 30,
height_units = 'screen',
fill_color = 'white',
line_color = 'navy',
line_width = 2,
border_radius = 5,
source = src
)
plot.text(
x = 'x',
y = 'y',
text_baseline = 'middle',
text_align = 'center',
text_font_size = '9pt',
text = 'node',
source = src
)
plot.inverted_triangle(
x = 'x',
y = 'arrow_y',
color = 'black',
size = 8,
source = src
)
hover = HoverTool(tooltips=[('Node', '@node')], renderers = [r_rect])
plot.add_tools(hover)
code = '''
const idx = source.inspected.indices;
console.log('Item: ' + source.data['node'][idx]);
const canvas_dy = plot.inner_height;
console.log(canvas_dy);
const rng_y0 = yrng.start;
const rng_y1 = yrng.end;
console.log(rng_y0);
console.log(rng_y1);
'''
callback = CustomJS(args = {'source': src, 'plot': plot, 'yrng': plot.y_range}, code=code)
plot.add_tools(
TapTool(
callback = callback,
behavior ='inspect',
renderers = [r_rect]))
plot.toolbar.autohide = True
plot.axis.visible = False
plot.grid.visible = False
plot.outline_line_color = None
save(plot)