Hello there,
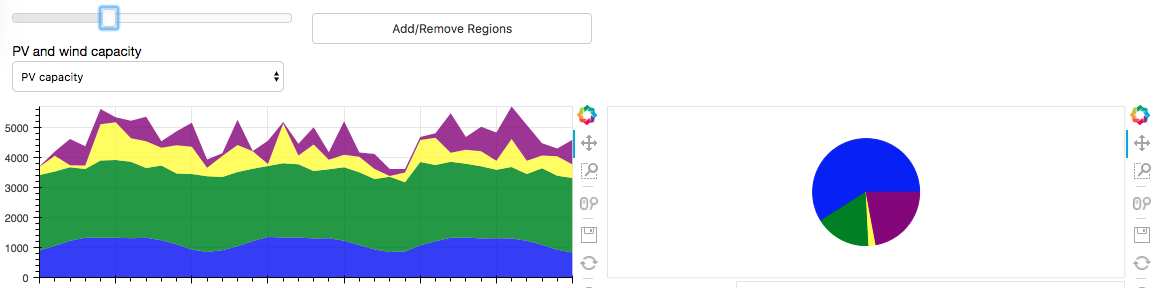
As you can see in the picture, I have made two figures, one with patches and one with the wedge glyph.
The wedges capture the same values as in the graph, for every different point in the graph from 0 to 35.
By using a slider I can change these values and get the different wedges.
Would it be possible to change the values of the wedges by using a hovertool instead?
More concretely, is it possible when I point with the hovertool on the leftmost graph at x=3, to get the same value as when the slider has the value 3?
And another issue that I can’t seem to resolve is how to change the x-axis values of the patches from 0 to 35 into timestamps from 01-01-2014 to 31-12-2016.
Any ideas?
Thanks