On Mar 11, 2017, at 10:30, Kasia Rachuta <[email protected]> wrote:
Hi Bryan,
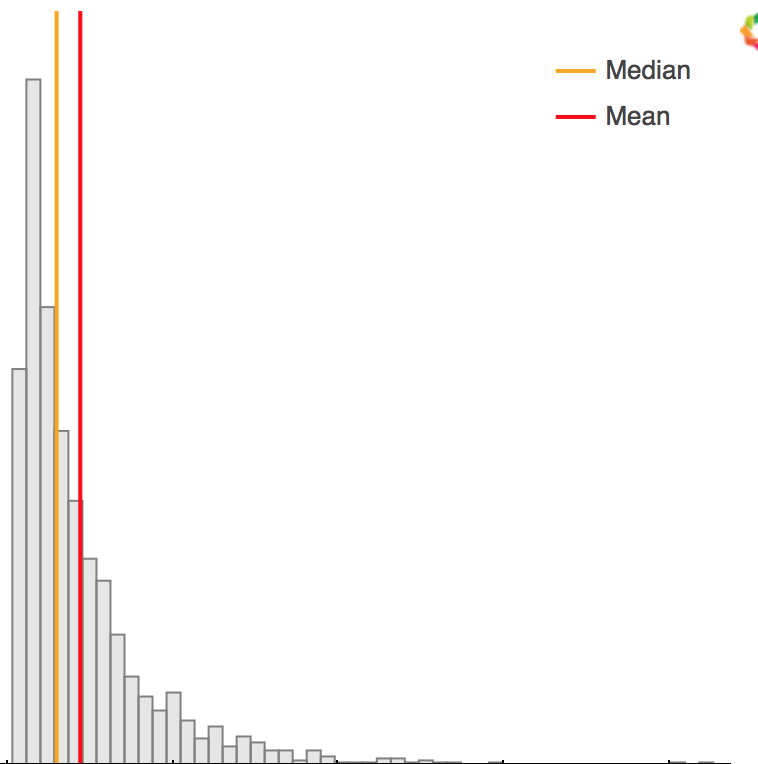
This works like a dream, thanks! The one problem is that when I try to change the fill_alpha to 0.2, I still get the boundaries. Is there any way to change that?
My code is:
p = Histogram(visits, values='rate', xlabel='Rate', ylabel='Promotion count', plot_width=450, plot_height=450,
fill_alpha=0.2, outline_line_alpha=0, line_color='white', notebook=True, tools=False,
bins=50, color='grey')
for r in p.renderers:
try:
r.glyph.line_color = r.glyph.fill_color
r.glyph.fill_alpha = 1.0
except:
pass
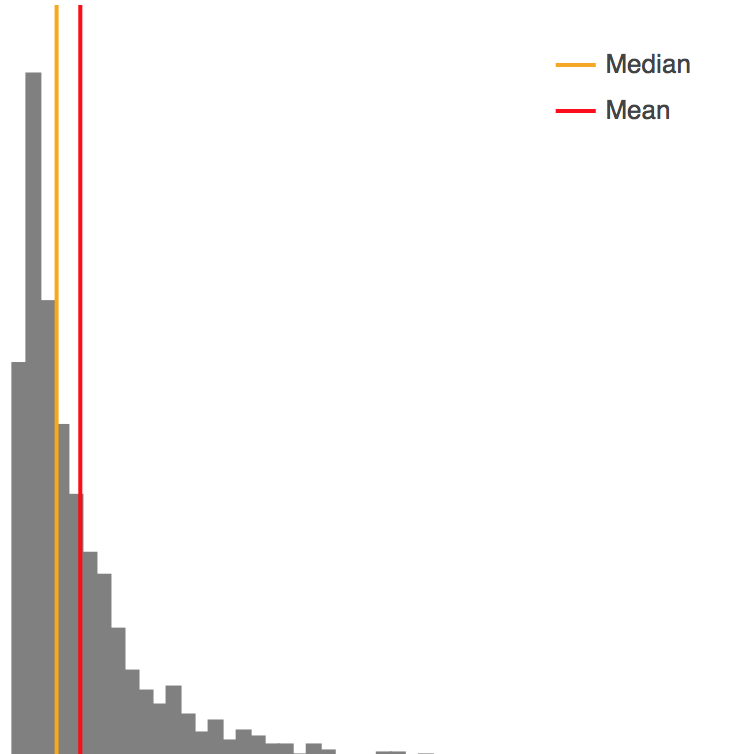
and then I change r.glyph.fill_alpha to 0.2. The first screenshot is for fill 1.0, the second one is for 0.2.
Thanks a lot for your help!
On Friday, 10 March 2017 19:04:57 UTC-8, Bryan Van de ven wrote:
Hi,
I assume you are using bokeh.charts.Histogram? There's not a great way to accomplish this built in at the moment, but this will work:
    hist = Histogram(df, values='hp', color='cyl',

                     title="HP Distribution by Cylinder Count", legend='top_right')


    for r in hist.renderers:

        try:

            r.glyph.line_color = r.glyph.fill_color

            r.glyph.fill_alpha = 1.0

        except:

            pass
Thanks,
Bryan
> On Mar 9, 2017, at 13:18, Kasia Rachuta <[email protected]> wrote:
>
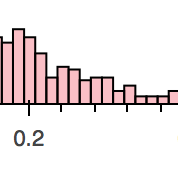
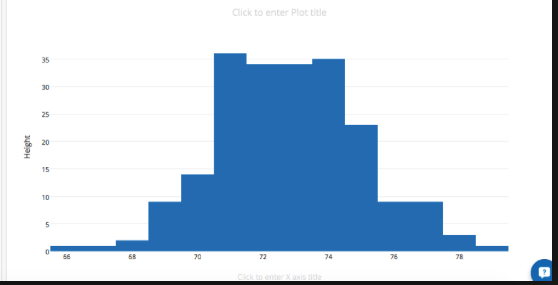
> I'm creating a histogram and ideally, I don't want there to be any boundary lines around each bar (right now, there are black)? I took a screenshot of some of the bars I have (I can't show the full histogram to preserve confidentiality) and I'd like to show something like the blue histogram
>
> --
> You received this message because you are subscribed to the Google Groups "Bokeh Discussion - Public" group.
> To unsubscribe from this group and stop receiving emails from it, send an email to bokeh+un...@continuum.io.
> To post to this group, send email to bo...@continuum.io.
> To view this discussion on the web visit https://groups.google.com/a/continuum.io/d/msgid/bokeh/8505feb9-d3ab-4cd3-9a9c-eef7a40737ea%40continuum.io\.
> For more options, visit https://groups.google.com/a/continuum.io/d/optout\.
> <Screen Shot 2017-03-09 at 11.14.55 AM.png><Screen Shot 2017-03-09 at 11.18.01 AM.png>
--
You received this message because you are subscribed to the Google Groups "Bokeh Discussion - Public" group.
To unsubscribe from this group and stop receiving emails from it, send an email to [email protected].
To post to this group, send email to [email protected].
To view this discussion on the web visit https://groups.google.com/a/continuum.io/d/msgid/bokeh/aacf25b1-13c3-4a7b-8b68-0cbdb2e96747%40continuum.io\.
For more options, visit https://groups.google.com/a/continuum.io/d/optout\.
<Screen Shot 2017-03-11 at 8.28.01 AM.png><Screen Shot 2017-03-11 at 8.28.36 AM.png>