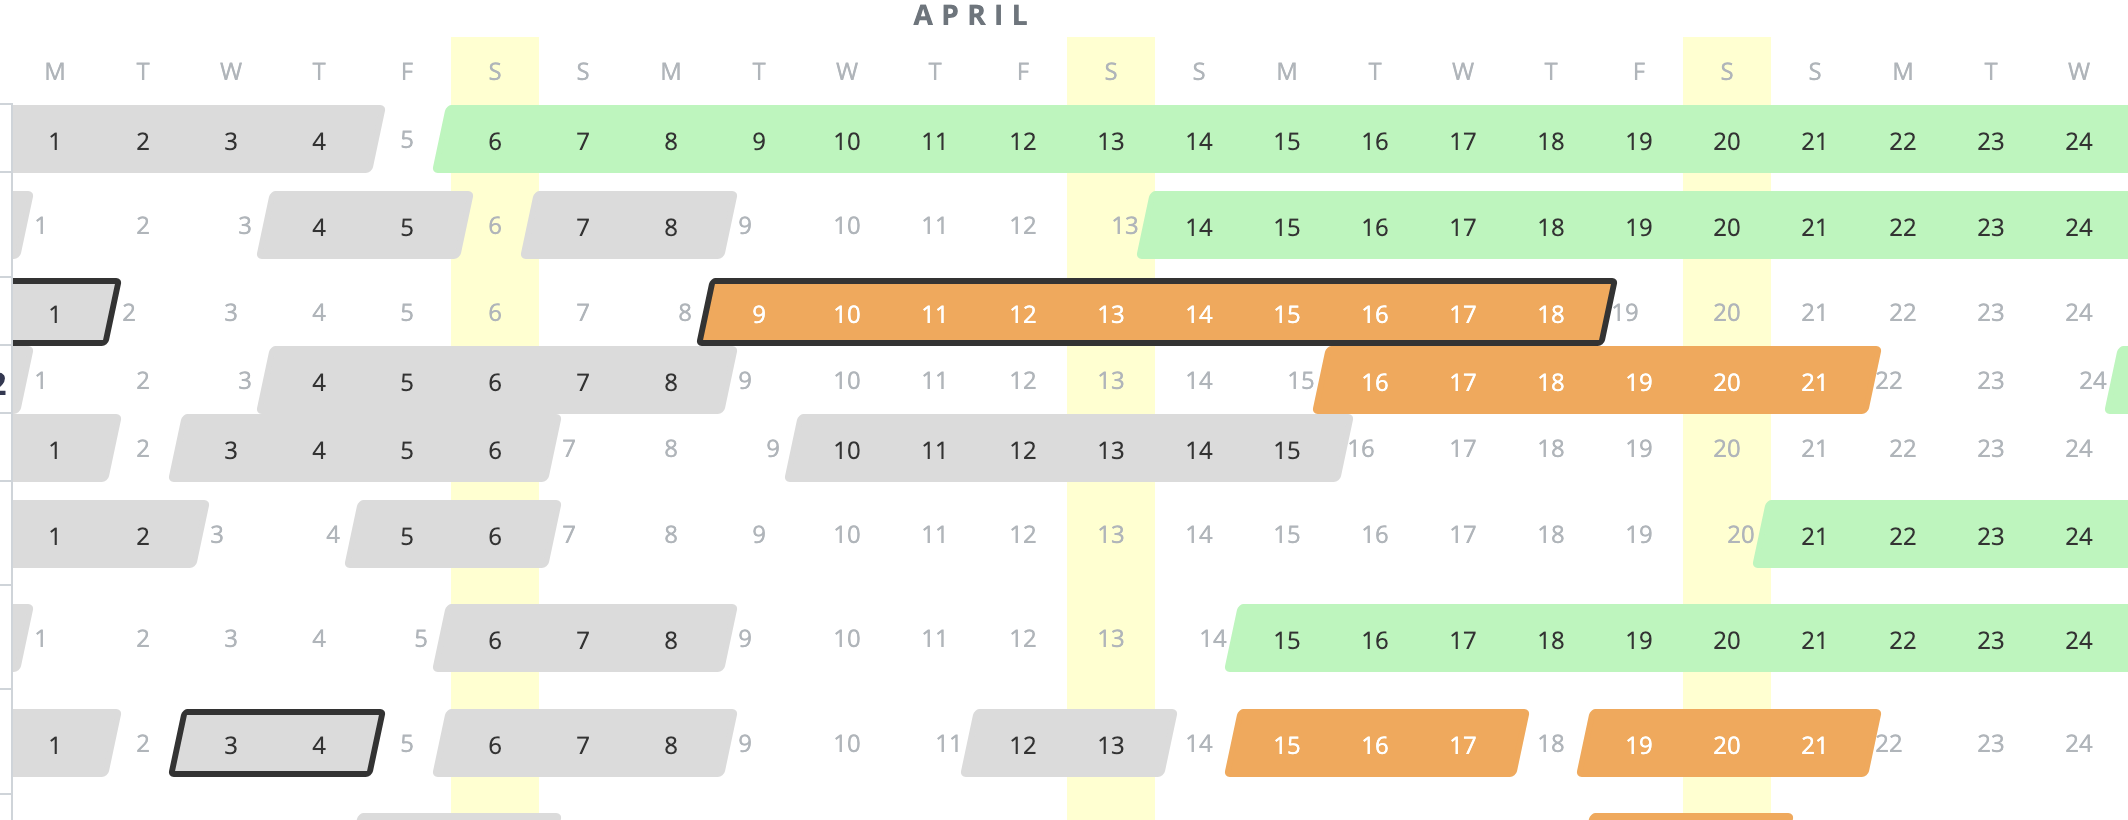
I am trying to make a stacked horizontal bar chart similar to the below screen shot. Categories for the y-axis, with start and end dates for events defining the bars. There can be gaps between events, so there would be “emptiness” between some events, hence “broken” bars.
What do you think? How would you go about making something like this? Thank you in advance.
hbar_stack is only for stacking an equal number of bars in each row. In principle, you could have some invisible bars with alpha=0 to insert gaps, as long as it is consistent with the equal number of bars criteria. But your plot does not look like that at all, some of the rows only have 4 bars (including gaps) while others have 12 bars (including gaps). So one hbar_stack will not be appropriate to plot all of them at once. You could make things work by calling a new hbar_stack for every row, maybe that’s even what you have in mind .
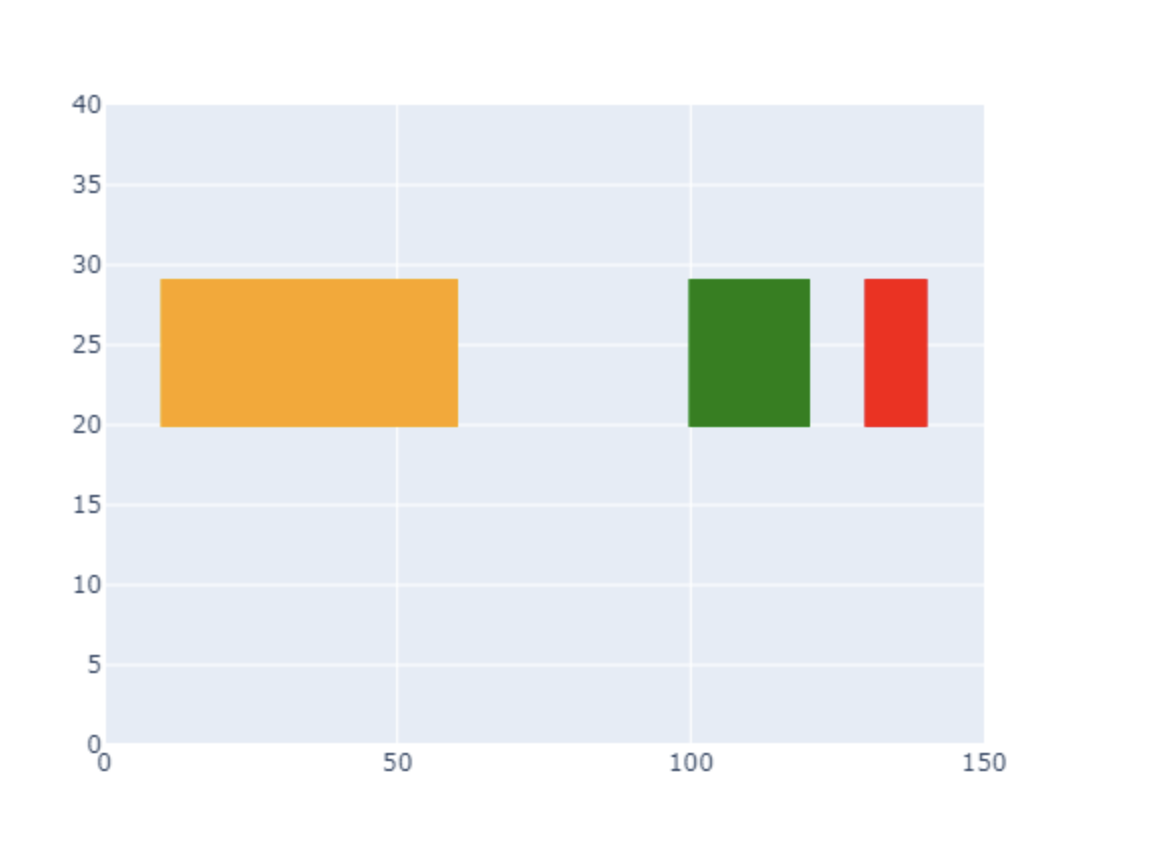
But if I was trying to make that chart, I would probably just just quad or hbar or rect or block and position all the “bars” individually, by computing their appropriate positions myself.