I have a series of plots that share an axis and only the bottom plot has the axis visible. The user can toggle the visibility of plots and this means they can turn off the plot with the visible axis. I could deal with this by turning the axis on for the bottom most visible plot every time a visible property changes, but I am hoping I can add an axis to the bottom of a column without it being tied to the particular plot.
I tried some silly things like creating a 0 height plot to own the axis but that doesn’t quite work unfortunately.
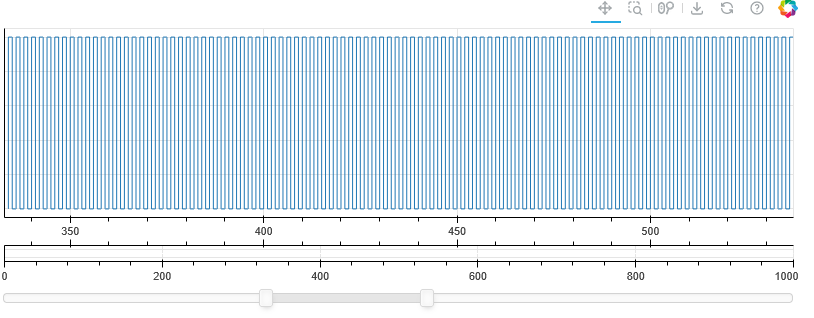
I’m sure you’d suggest the range slider in the gallery, but I have too much data and the window becomes too small to manipulate. This effect gives the impression that the slider has the full range while the plot has the windowed range.
I apologize that I used your excellent tool this way.
Understood.
My case is unusual b/c of the size of the data and the nice RangeTool just doesn’t provide a consistent grip or drag location the way that slider does.
I essentially created a plot with a data point at x[0] and x[-1] so the normal axis would have the full range. Then I added a second axis above it for the x_range. Then I changed the color of the line to white and shrunk the plot height to about 60. I did add the RangeTool in as well b/c I think it has a nice effect to more tightly couple the xrange to the top axis visually.
I’m thinking now, I can have a nicer effect by using datashader to render the full dataset as a more proper thumbnail.