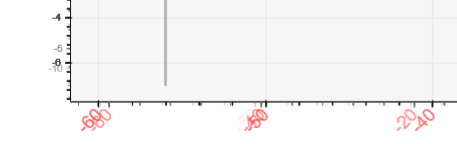
Each time a graph is generated, the graph is updating but I keep seeing from time time the previous axis.
I have tried to use graph.x_range.bounds=“auto” or reload the axis using graph.x_range = DataRange1d() for the axis to update but I keep having issues as per attached.
This is pretty odd looking, I have not seen anything like it, so would have to be able to reproduce it to investigate to be able to say anything substantive. Can you provide a complete, minimal, runnable example that reproduces the problem so that it can be investigated?
I am using a bokeh server to generate graph.
Each time a graph is generated, the graph is updating but I keep seeing from time time the previous axis.
I have tried to use graph.x_range.bounds="auto" or reload the axis using graph.x_range = DataRange1d() for the axis to update but I keep having issues as per attached.
On Tue, Nov 29, 2016 at 3:18 PM, Bryan Van de Ven [email protected] wrote:
This is pretty odd looking, I have not seen anything like it, so would have to be able to reproduce it to investigate to be able to say anything substantive. Can you provide a complete, minimal, runnable example that reproduces the problem so that it can be investigated?
Each time a graph is generated, the graph is updating but I keep seeing from time time the previous axis.
I have tried to use graph.x_range.bounds=“auto” or reload the axis using graph.x_range = DataRange1d() for the axis to update but I keep having issues as per attached.
Thanks a lot for your help,
–
You received this message because you are subscribed to the Google Groups “Bokeh Discussion - Public” group.
To unsubscribe from this group and stop receiving emails from it, send an email to [email protected].
Bryan,
I found the issue. maybe I was duplicating the layout properties some how but basically I was defining my properties at the start like in Sarah Bird’s demo
When I erase all my properties at the top and put them in each graph, that works properly.
Thanks,
···
On Tue, Nov 29, 2016 at 3:31 PM, Patrick Houel [email protected] wrote:
Sure. I will work on one example to send over
–
On Tue, Nov 29, 2016 at 3:18 PM, Bryan Van de Ven [email protected] wrote:
This is pretty odd looking, I have not seen anything like it, so would have to be able to reproduce it to investigate to be able to say anything substantive. Can you provide a complete, minimal, runnable example that reproduces the problem so that it can be investigated?
Each time a graph is generated, the graph is updating but I keep seeing from time time the previous axis.
I have tried to use graph.x_range.bounds=“auto” or reload the axis using graph.x_range = DataRange1d() for the axis to update but I keep having issues as per attached.
Thanks a lot for your help,
–
You received this message because you are subscribed to the Google Groups “Bokeh Discussion - Public” group.
To unsubscribe from this group and stop receiving emails from it, send an email to [email protected].