Hi there,
I’m trying to make a box plot with some values spanning ~3 orders of magnitude on a log y axis. I’d like to have more major tick values on the y axis than just the integer powers of 10, but I can’t seem to get it to. I’ve tried setting all the relevant-seeming LogTicker attributes to no avail.
desired_num_ticks appears to be disregarded. No set of integers in mantissas appears to change anything. The min and max intervals also don’t seem to do much here.
Weirdly enough if I zoom in the plot, the additional major ticks appear, but I’d like them to also be present for the inital graph.
I’m a bit stumped, is this intended LogTicker behaviour or have I missed something? I’d appreciate it if someone could give some guidance!
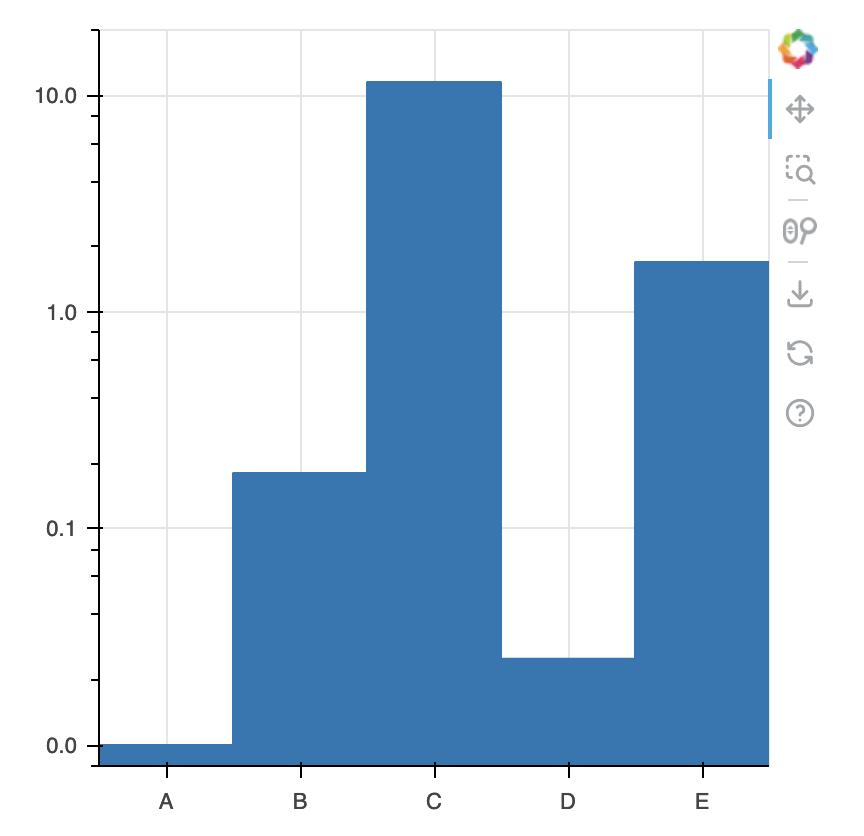
Here’s a snippet which produces the following plot with high desired_num_ticks in Jupyter Notebook; bokeh 3.1.1:
from bokeh.plotting import figure
from bokeh.models import PrintfTickFormatter, LogTicker
from bokeh.io import output_notebook, show

output_notebook()

data = [0.01,0.18,11.5,0.025,1.7]
categories = ['A', 'B', 'C', 'D', 'E',]

p = figure(width=400, height=400, x_range=categories, y_axis_type='log', y_range=(0.008, 20))
p.vbar(x=categories, top=data, bottom=10**-10)
p.yaxis.formatter = PrintfTickFormatter(format="%1.1f")
p.yaxis.ticker = LogTicker(base=10, mantissas=[2,5], num_minor_ticks=5, desired_num_ticks=20)
show(p)