Hello Bokeh Community,
I am developing an application using Bokeh that dynamically adds new tabs. However, I’m facing some issues and am posting to seek your help.
Here is my environment and the code I used to identify the problem.
- bokeh version: 3.1.0, 3.2.0
- browser version:
chrome 114.0.5735.199 (Official Build) (64bit)
edge 114.0.1823.79 (Official Build) (64bit)
from bokeh.plotting import figure, curdoc
from bokeh.layouts import column
from bokeh.models.widgets import DataTable, TableColumn, Button
from bokeh.models import Tabs, TabPanel, ColumnDataSource

def button_callback():
    # make graph and table
    source = ColumnDataSource(data=dict(x=[1, 2, 3], y=[4, 5, 6]))
    plot = figure(width=400, height=300)
    plot.line('x', 'y', source=source)

    columns = [
        TableColumn(field="x", title="X"),
        TableColumn(field="y", title="Y")
    ]
    data_table = DataTable(source=source, columns=columns, editable=True)
    # layout graph and table
    layout = column(plot, data_table)
    # add tab
    tab = TabPanel(child=layout, title="New Tab")
    tabs.tabs.append(tab)

# setup callback
button = Button(label="Add Tab")
button.on_click(button_callback)

# initial tab
source = ColumnDataSource(data=dict(x=[1, 2, 3], y=[4, 5, 6]))
plot = figure(width=400, height=300)
plot.line('x', 'y', source=source)
columns = [
    TableColumn(field="x", title="X"),
    TableColumn(field="y", title="Y")
]
data_table = DataTable(source=source, columns=columns, editable=True)

layout = column(plot, data_table)
initial_tab = TabPanel(child=layout, title="Initial Tab")
# create tab
tabs = Tabs(tabs=[initial_tab])
curdoc().add_root(column(button, tabs))
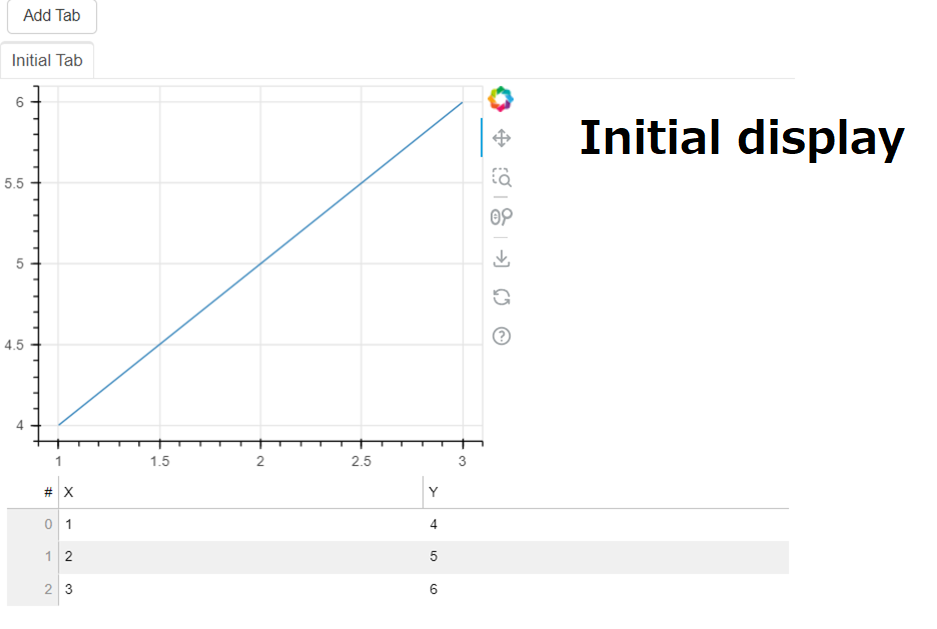
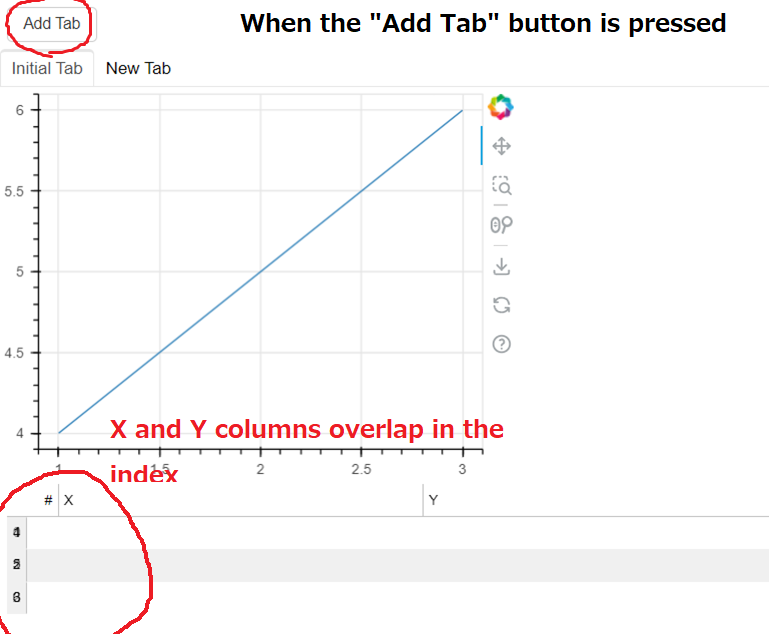
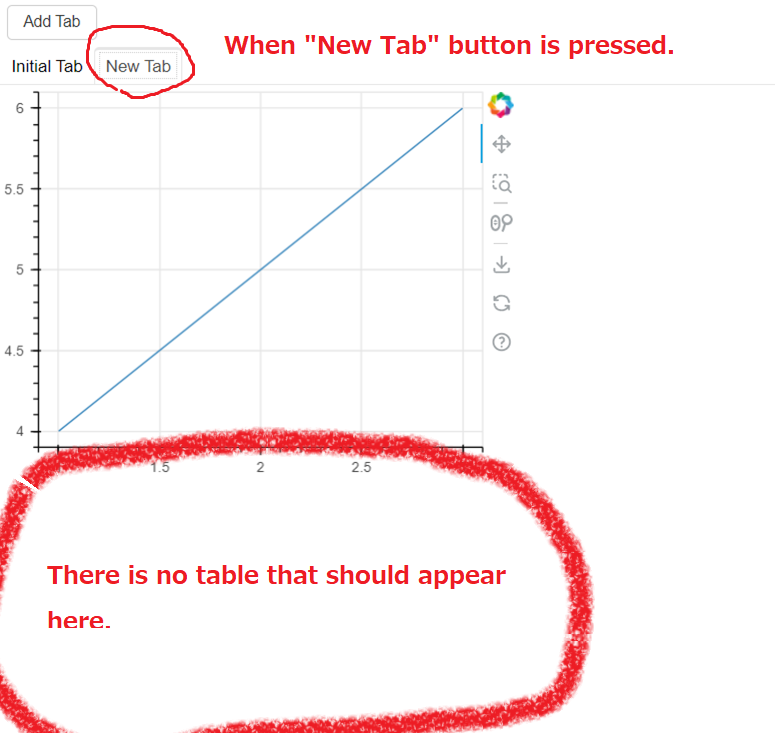
When I run this code on the Bokeh server, a graph and table are displayed on the initial screen. However, when I click the “Add Tab” button to open a new tab, only the graph is displayed in the new tab, with no table appearing.
Also, the display of the table in the original tab is disrupted, with numerical values overwriting the index rows.
Interestingly, I do not encounter this issue when adding new tabs outside the callback. It appears that this issue occurs only when adding tabs from the callback.
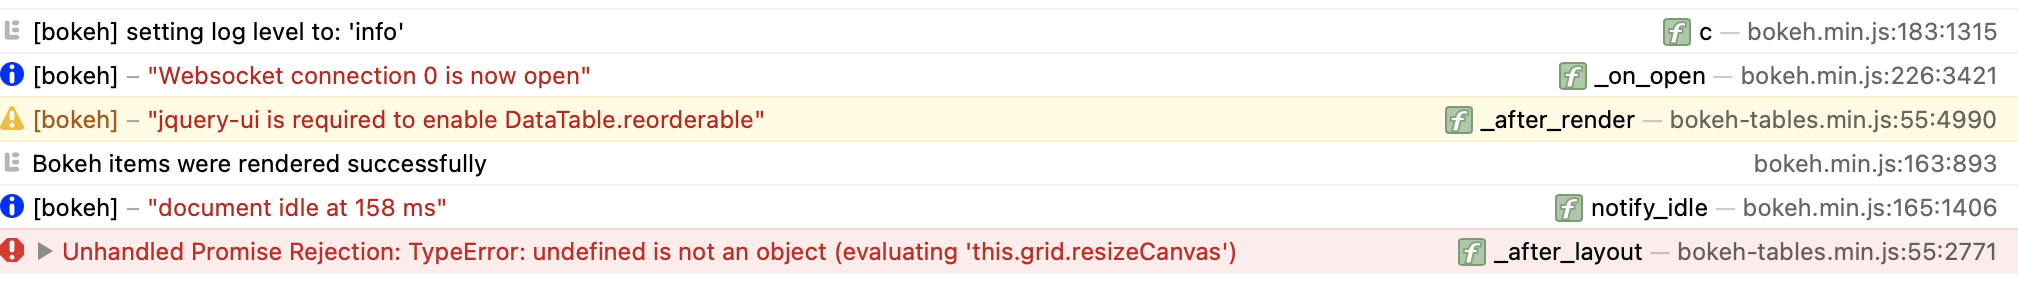
Additionally, I receive the following error message in the browser’s console:
Uncaught (in promise) TypeError: Cannot read properties of undefined (reading 'resizeCanvas')
    at M._after_layout ...
My expected result is that when a new tab is opened, a new graph and table are displayed. Also, the display of the table in the original tab should be maintained without disruption.
If you have any suggestions or assistance for this issue, please let me know.
Thank you for your help.