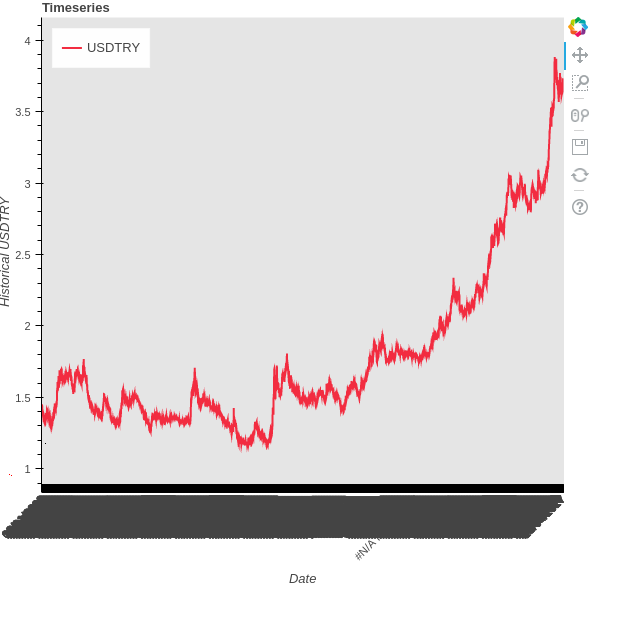
I am trying to make a Timeseries chart showing the price of a currency for each day for the last 15 years.
But the end result just a mess when there is ticker for each day for the given time period. Is there a quick fix to show just have a one item for each year in the x axis?
And secondly, I am trying to have just the year in the x axis instead of of the full date ( 2002 instead of 01/01/2002 for example), any easy way to achieve that?
Thanks.
A portion of my data:
Date
PX_LAST
01/01/2002
1.45
02/01/2002
1.447
03/01/2002
1.4225
04/01/2002
1.4175
import pandas as pd
from bokeh.charts import TimeSeries, show, output_file
from bokeh.models import FixedTicker
from bokeh.models import SingleIntervalTicker, LinearAxis
On Saturday, April 15, 2017 at 6:52:28 PM UTC+2, firat wrote:
I am trying to make a Timeseries chart showing the price of a currency for each day for the last 15 years.
But the end result just a mess when there is ticker for each day for the given time period. Is there a quick fix to show just have a one item for each year in the x axis?
And secondly, I am trying to have just the year in the x axis instead of of the full date ( 2002 instead of 01/01/2002 for example), any easy way to achieve that?
Thanks.
A portion of my data:
Date
PX_LAST
01/01/2002
1.45
02/01/2002
1.447
03/01/2002
1.4225
04/01/2002
1.4175
import pandas as pd
from bokeh.charts import TimeSeries, show, output_file
from bokeh.models import FixedTicker
from bokeh.models import SingleIntervalTicker, LinearAxis