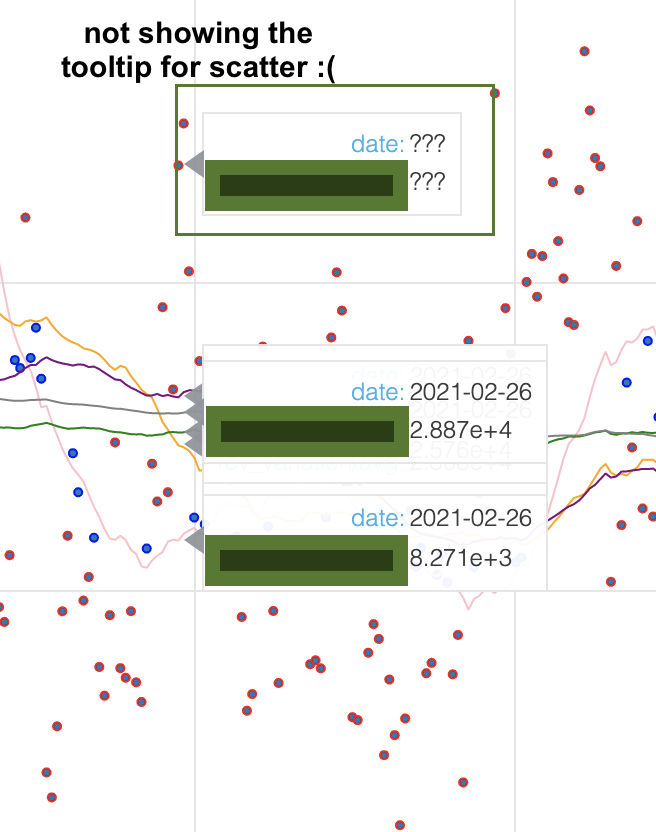
I’m trying to display a tooltip for my scatter plot. All tooltips for the line plots are showing up but not the scatter plot, I noticed that after I added the linear_cmap (which requires me to use the source param instead of x and y as columnar data) it messed up the tooltip.
This is an interactive plot within a jupyter notebook.
import ipywidgets as widgets
from ipywidgets import interact
import pandas as pd
from bokeh.plotting import figure, show
from bokeh.models import HoverTool
from bokeh.transform import factor_cmap, linear_cmap
from bokeh.models import ColorBar


all_df = pd.Dataframe({
'date': ['2021-01-01', '2021-01-02', '2021-01-03'],
'country': ['X','X','X'],
'metric1': [100,200,300],
'is_outlier_metric1_30': [100,200,300],
'metric1_avg_30'': [50, 60, 70],
'metric1_avg_60'': [50, 55, 60],
})

all_df['date'] = pd.to_datetime(all_df['date'], format='%Y-%m-%d')

# in another cell within a jupyter notebook
@interact
def scatter_plot(cty=list(all_df['country'].unique()),
                rolling_window=[30,60,90,180,360],
                 z_std_thresh = [2, 3],
                 delta_type=['metric1', 'metric2']):

    temp_df = all_df[all_df['country'] == cty]
    temp_df = temp_df[(temp_df.index >= '2021-01-01') & (temp_df.index <= '2021-12-31')]
    temp_df = apply_threshold(temp_df, z_std_thresh, delta_type)
    outlier_df = temp_df[temp_df[f'is_outlier_{delta_type}_{rolling_window}'] == 1]
    nom_str = 'Nominal' if delta_type == 'rev_variation_z' else 'Percent'

    p = figure(width=1200, height=800, x_axis_type="datetime")
    index_cmap = linear_cmap('category', palette=['blue', 'red'], low=0, high=1)
    temp_source = ColumnDataSource(temp_df)
    p.scatter(x='date' , y=delta_type, source=temp_source, line_color=index_cmap)
    p.line(x=temp_df.index , y=temp_df[f'{delta_type}_avg_30'], line_color= "pink")
    p.line(x=temp_df.index , y=temp_df[f'{delta_type}_avg_60'], line_color= "orange")

    hover = HoverTool(tooltips=[('date', '@x{%F}'), ('delta_type/avg', '@y')], formatters={'@x': 'datetime'}, mode='vline')
    p.add_tools(hover)

    color_bar = ColorBar(color_mapper=index_cmap['transform'], width=8)
    p.add_layout(color_bar, 'right')
    show(p)
What have you tried that did NOT work as expected? If you have also posted this question elsewhere (e.g. StackOverflow), please include a link to that post.
Here is a screenshot of what’s going on.