Keep axis and font size proportion when exporting bigger plots with export_png

There is a way to increase the resolution when the plot is exported with export_png, that is setting width and height directly in the method:

export_png(p2, filename="plot.png", height=300, width=300)

plot_300

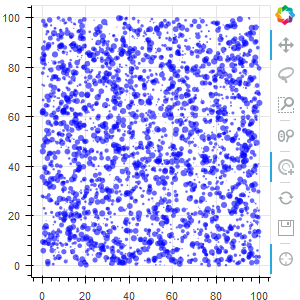
The problem is that the axis keep always the same size, no matter how big the plot is:

export_png(p2, filename="plot.png", height=1200, width=1200)

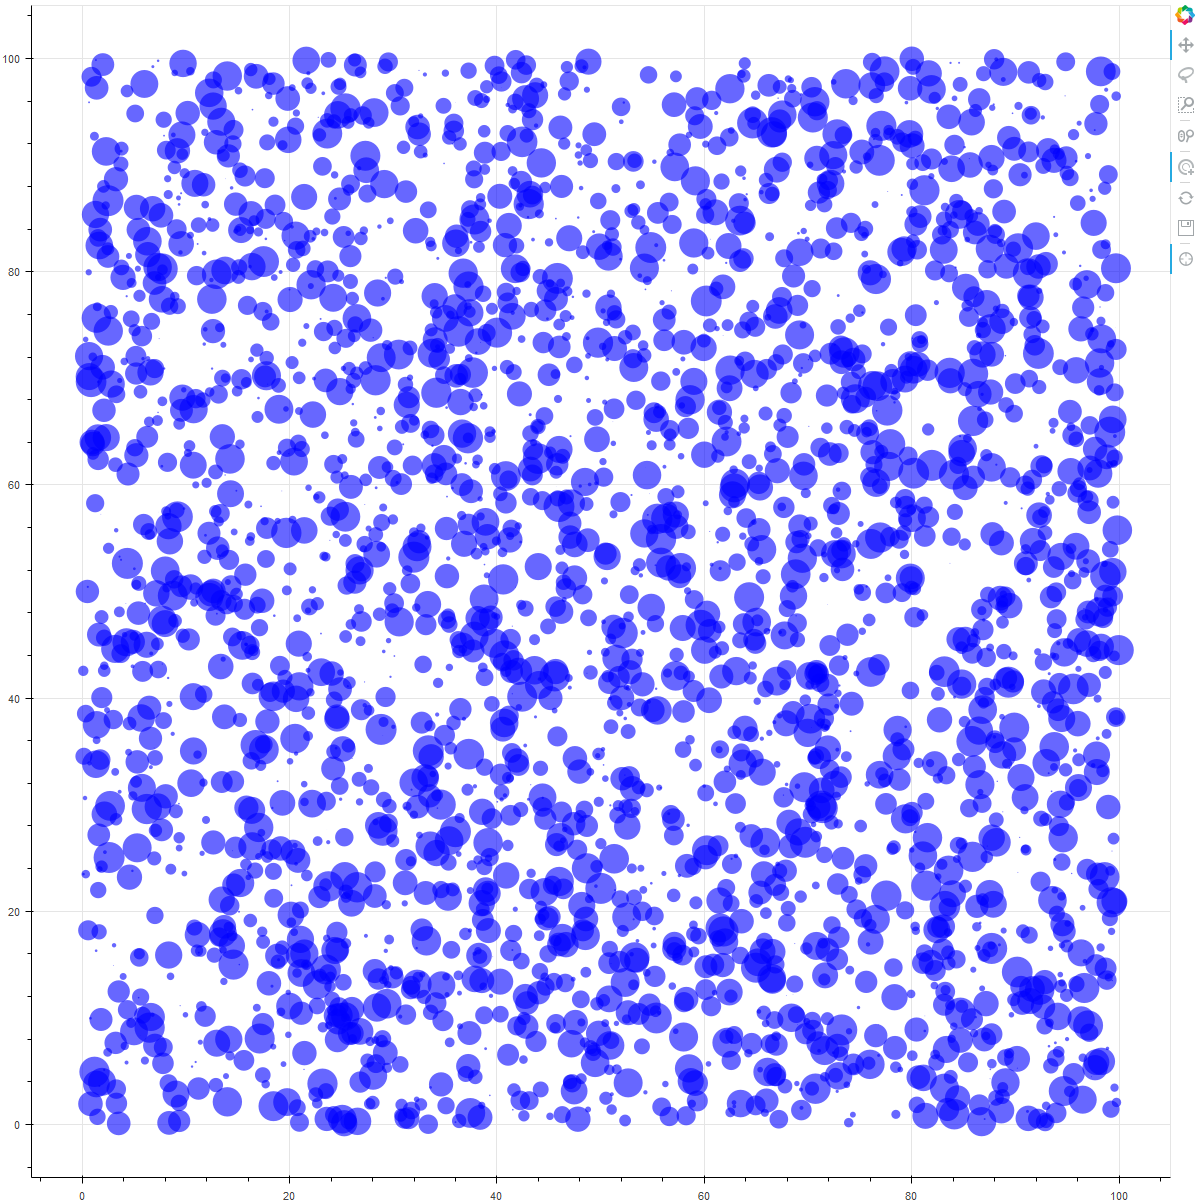
The possible solution right now is to update the axis attributes manually. I think an easy fix would be to increase, in proportion, the size of the axis and title elements when exporting.

@jcacabelos we could certainly consider a PR for something like this if it is something you want to work up. That said, fonts can accept a wide variety of CSS font size units:

 em|ex|ch|ic|rem|vw|vh|vi|vb|vmin|vmax|cm|mm|q|in|pc|pt|px 

Some of these are supposedly relative to other elements in the document (though I don’t have experience with them myself) I would suggest first investigating whether using different units might also work, in which case we could simply document that.