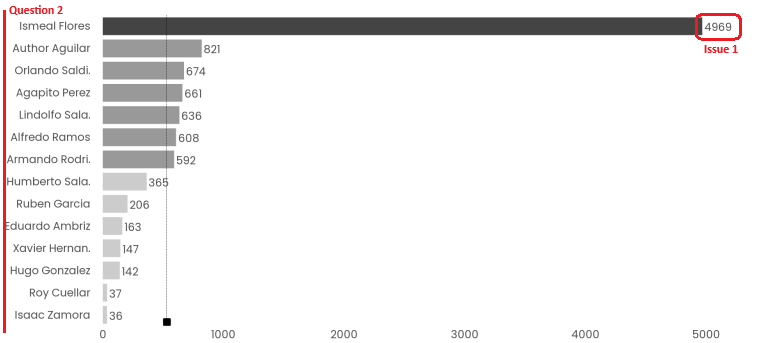
I have two issues with bokeh horizontal bar plot, I marked them in red in the image attached.
1 - Depending on the number of bars, legend at the end of the bars get missaligned in the Y axis. I have to use some cumbersome y_offset values that are a funtion of the number of elements Y array has.
2- This is more a question than an issue. Is it possible to justify Y axis labels to the right? I tried some kind of dirty patch adding whitespaces to the right of the names to make them the same number of characters but it did’t work.
@Alain_Sanchez I don’t actually understand what you are asking for. The red-circled label looks aligned vertically within the bar height to me, and also offset to the right of the bar the same amount. What, very exactly and precisely, do you want to see different?
Also not clear on issue 2, are those actual axis label that are drawn by an axis? Or did you manually add labels to look like an axis?
All of these ambiguities can be cleared up with a complete Minimal Reproducible Example, which is always, always advised to priovide. Without an MRE I will probably not be able to offer any concrete guidance, just general suggestions.
This is an actual bokeh plot. Nothing has been drawn manually.
First, as you correctly point out, labels are correctly aligned vertically and horizontally in the image, BUT when graph have few bars, say 3, labels get missaligned vertically. The same happens if it has too many bars, 50 for instance.
Y is a categorical axis. I want names to be left-justified instead of right, like below:
That’s not what I meant. I was asking whether those axis labels are the usual labels the any Bokeh axis would draw, or whether you “manually” made an axis by adding Label or LabelSet yourself. I asked because that is obviously not a default axis, since there is axis rule, and the font is not the default font. Without code, there is no way for me to know what you are precisely doing, e.g. whether you have heavily customized the standard axis or replaced the standard axis with your own labels. Yet, this is crucial information.
Unfortunately, I can’t offer any advice without code to run and reproduce. If that’s a standard categorical axis then the labels should be right justified by default AFAIK, so it would take actual direct investigation to be able to determined what might actually be going on for you. [1] Same with the other bar mis-aligned labels (I still don’t see any in these images? So there is just nothing to go on to speculate)
See e.g. this example where all the categorical axis labels are right aligned with no special configuration. ↩︎
Yes Bryan, I made the axis using a LabelSet. Also, as you said, categotical axis have labels right justified by default. Justify them to the left is exactly what I want.
Sorry for not putting the code here. I have to ask if there would be any legal issue with that.
Great that you realized that I’m not using a default font. Actually I’m using a Google font (Poppins). That’s another nigthtmare, because I want to save the plot as a png image, and it won’t change the font until you interact with it; so I had to save the graph as a html page first, load it with Selenium and do some drag, to finally save the canvas screenshot as a png.
This story rises another question. Is there a straightforward way to add a Google font to the plot to export it after as a png image?
I’m confused, do you want them justified to the right, or to the left?
Is it possible to justify Y axis labels to the right?
Justify them to the left is exactly what I want.
You originally asked about justifying to the right, in which case I would suggest using a regular categorical axis, which already does that by default, instead of manual labels.
This story rises another question. Is there a straightforward way to add a Google font to the plot to export it after as a png image?
I have to ask if there would be any legal issue with that.
I can only suggest trying to impress on the powers that be that the price of free software is being able to help others help you. If your requirements include confidential support then you’d probably be better off looking into commercial offerings.
It is always advised to provide all relevant version information in every OSS question (here, on Stack Overflow, on issue trackers, anywhere). ↩︎
Thank you again @Bryan. Sorry if I might be inaccurate, I’m not very experienced in these forums things. Also I’m not an english native. But again… I’m very gratefull for your swift answers.
I’m using bokeh 3.4.0.
I want left justification. Sorry If I misslead.
As a poor third country young programmer, you have not too much laverage on the powers that be, you simply grab what you can, and depend on the kindness of those willing to help. It is what it is (this is pure information, not a complain).
In that case the font issue could be a bug, and the appropriate step would be to make a GitHub Issue. But there is also a possibility that you are trying to load the font in some unexpected way. These are thing things that simply can’t be determined without having the actual code to reproduce.
I want left justification.
In that case, if you are using labels, then you would want to set the anchor property to be one of the “left” options. See e.g. the example in this section.
Question: How can I align Y-Axis names to de left?
I don’t actually believe it is possible with axis labels. [1] I think you would need to use “manual” labels (e.g. Label or LabelSet or text) with their anchor set to one of the “left” options, as I stated earlier.
Finally, can you suggest any doc on how to use a local font (an otf file specifically) in a bokeh plot?
AFAIK you would need to embed the Bokeh output in a custom HTML template, and then include the fonts in the <head> of the template, as you would in any HTML page. That is, Bokeh does not have any APIs for including fonts. I think there may be a relevant example here:
We pass on the text align property generically down to the canvas APIs. It only applies to the bounding box that the text lives in, though, and in this case, I believe each axis label has a tight bounding box, making the text align property not-useful in this instance. Correct me if I am mistaken, @mateusz↩︎
We pass on the text align property generically down to the canvas APIs…
I see. In that case, it would be a nice feature to set the size of the bounding box for all elements in cat_axis_labels to something like max([len(i) for i in cat_axis_labels]), so the text alignment property do something. In fact, I did test that and, as you say, doesn’t work.
I don’t disagree, but there are some subtleties that would have to be addressed, it’s not so simple (it never is), e.g.
if the axis labels are multi-line, then the align property does in fact currently have effect, since the sub-lines in multi-line labels might be different lengths within the overall bounding box. Will need to assess if changes here would be likely to break existing usage for anyone.
Just noting that the bounding boxes are only computed in the browser, so simple Python code like max([len(i) for i in cat_axis_labels]) won’t be able to solve this.
Further, property defaults are purely type-based. We can’t specify different property defaults based on whether the axis is on the left or right or top or bottom. But without a strict bounding box, the actual HTML align setting would have to be able to differ based on that. We would need to add some kind of Auto option, and that will mean a new property type and also new codepaths to condition on the Auto value.
What exactly would supposed to happen for, e.g. horizontal labels on a bottom axis? There’s probably a few options, they would need to be considered and weighed.
It appears there is an old issue that was never moved beyond discussion. If you want to chime in there, perhaps we can re-asses this idea, and re-triage it.
@Alain_Sanchez actually I see that issue was about the axis title, not the individual tick labels. I actually don’t see an issue for tick labels, so please feel free to open a new GitHub Issue about this topic.