What are you trying to do?
Make a label text that runs off a CustomJSTransform, where additional line breaks get added to the label text in the CustomJSTransform.
What have you tried that did NOT work as expected? If you have also posted this question elsewhere (e.g. StackOverflow), please include a link to that post.
The MRE demonstrates the following:
- Adding \n to strings on the python side (i.e. when the CDS is instantiated) works just fine.
- If I write up a basic CustomJSTransform that takes each current string in my label’s field, and I concatenate another string to them, that too works as expected,
- HOWEVER, if the string i’m concatenating ontains a line break, the labels don’t render, and I get:
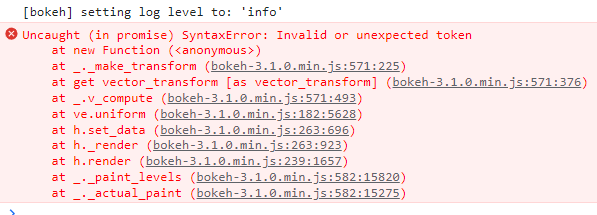
MRE:
from bokeh.models import CustomJSTransform, ColumnDataSource, LinearColorMapper, CustomJS, LabelSet, CustomJSTransform
from bokeh.plotting import figure, show

d = ColumnDataSource(data={'x':[0,3,5,2],'y':[1,2,3,10],'Thing':['what\nisthis','test','another','test for\nline breaking stuff']}) #all good

fig = figure()
r = fig.scatter(x='x',y='y',source=d,size=8,fill_color='blue')

lbl = LabelSet(x='x',y='y',text='Thing',source=d)
fig.add_layout(lbl)

tr = CustomJSTransform(v_func='''
                        var result = []
                        for (var i=0; i<xs.length; i++){
                                //try this with \n and without it
                                var upd_text = xs[i]+" here is more stuff\nwith a line break"
                                result.push(upd_text)
                                }
                        console.log(result)
                        return result
                        ''')
lbl.text = {'field':'Thing','transform':tr}

show(fig)
Not really sure if this is a) a bug report, b) a feature request, c) a usage issue or d) a design limitation…
Thanks…