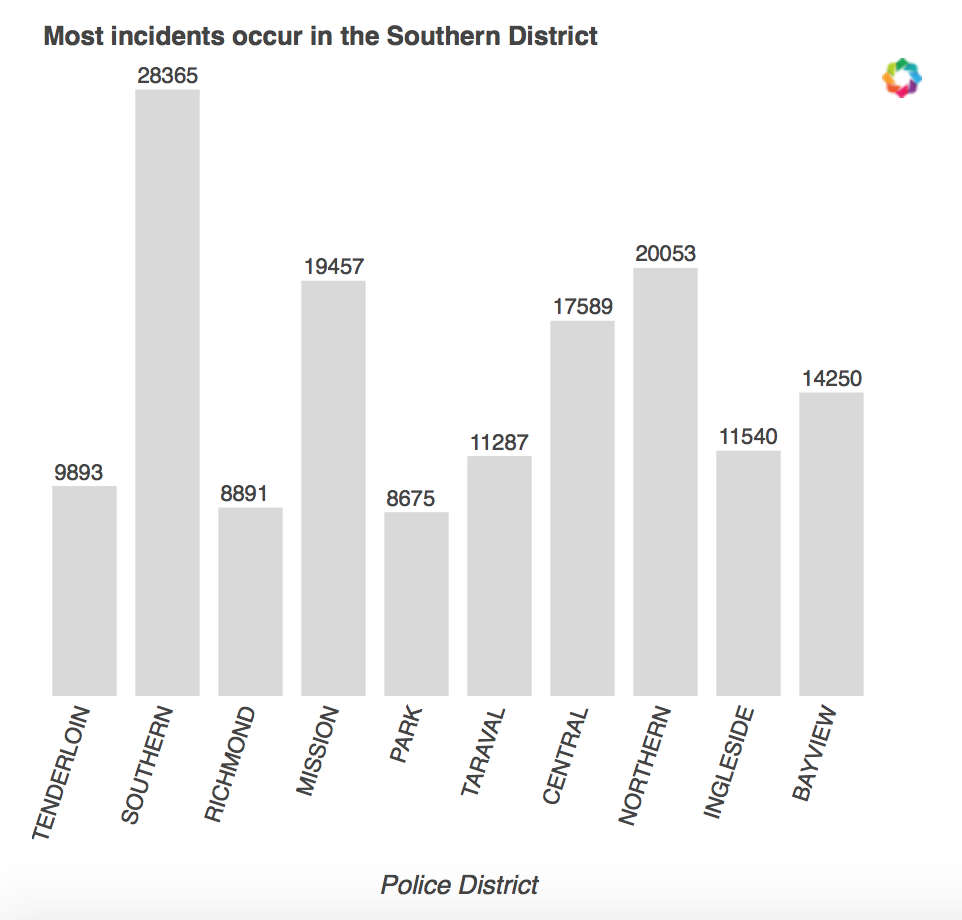
I’m trying to create a bar chart with labels above the bars (something like the screenshot attached). Now I’m re-using the code with a different data frame (data, although labels come from a different one that’s already aggregated) Underneath is my code which gives me the following error: "Javascript error adding output!
Error: Error rendering Bokeh model: could not find tag with id: 8c51aaa0-128b-4f6c-814f-b44d021a83cd
See your browser Javascript console for more details."
bar charts by vertical
source = ColumnDataSource(verticals)
p = Bar(data, values=‘vertical’, label=‘vertical’, agg=‘count’,
fill_alpha=0.3, outline_line_alpha=0, line_color=‘white’, notebook=True, tools=False,
color=‘grey’)
p.legend.location = None
p.title.text = ‘Most attempts come from X vertical’
labels = LabelSet(x=‘vertical’, y=‘count’, text=‘count’, level=‘glyph’,
x_offset=5, y_offset=5, source=source, render_mode=‘canvas’, text_font_size=“8pt”)
p.axis.minor_tick_in = 0
p.axis.minor_tick_out = 0
p.axis.major_tick_in = 0
p.axis.major_tick_out = 0
p.xgrid.grid_line_color = None
p.ygrid.grid_line_color = None
p.add_layout(labels)
show(p)