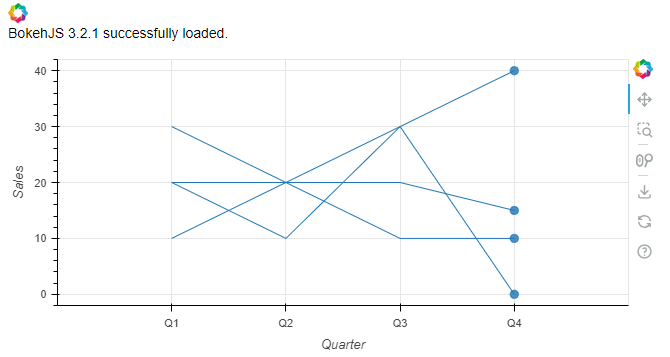
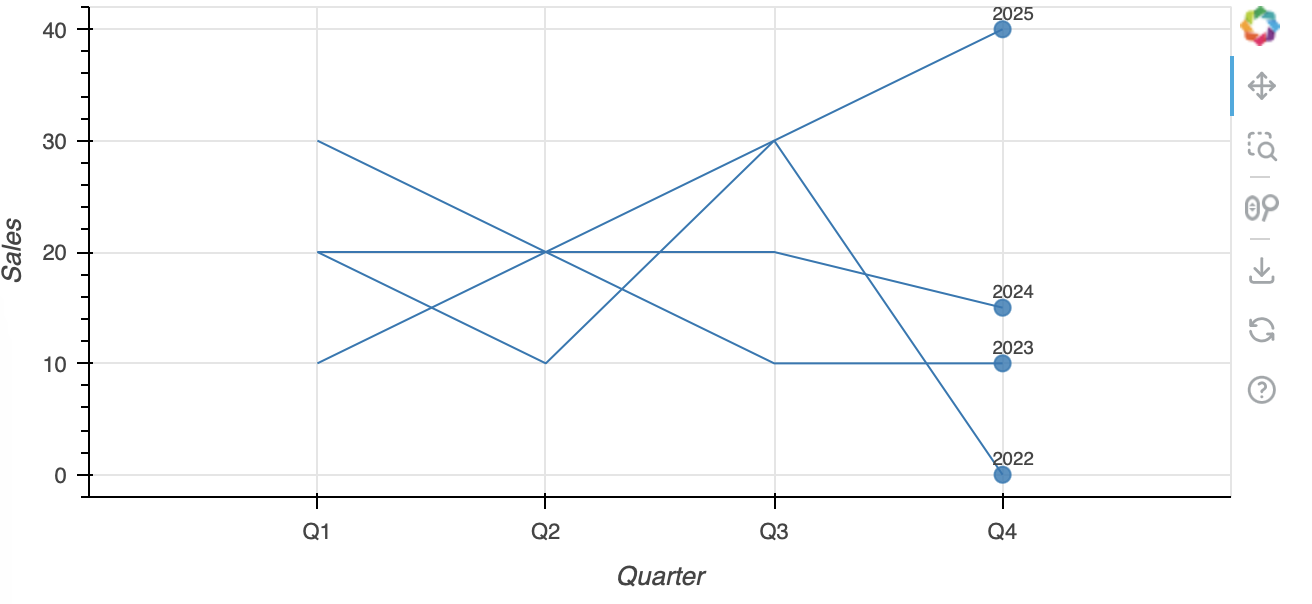
Below is minimal example to add line labels to a multi_line.
Also, is there a way to add multiline labels, too.
import pandas as pd
from bokeh.io import output_notebook
from bokeh.io import show
from bokeh.plotting import figure
from bokeh.models import ColumnDataSource, LabelSet

output_notebook()

Sales = [[10,20,30,0],[30,20,10,10],[20,20,20,15],[20,10,30,40]]
Sales_LastQ = [0,10,15,40]
Last_Q = [4]*4
Quarters = [[1,2,3,4]]*4
Years = ['2022','2023','2024','2025']

df_dict = {
    'Quarters': Quarters,
    'Sales': Sales,
}

df_dict_labels = {
    'Quarters': Last_Q,
    'Sales': Sales_LastQ,
    'Years': Years,
}

df = pd.DataFrame.from_dict(df_dict)
df_labels = pd.DataFrame.from_dict(df_dict_labels)

figure_seasonal_opts = dict(width=650, height=300, x_range=(0,5))

p = figure(**figure_seasonal_opts,)
p.xaxis.ticker = [1,2,3,4]
p.xaxis.major_label_overrides = {1: "Q1", 2: "Q2", 3: "Q3", 4: "Q4"}
p.xaxis.axis_label = "Quarter"
p.yaxis.axis_label = "Sales"

source = ColumnDataSource(data = df)
source_labels = ColumnDataSource(data = df_labels)

lines = p.multi_line(xs='Quarters', ys='Sales', source=source)

p.circle(x = 'Quarters', y = 'Sales', size=8, source = source_labels, alpha = 0.8)

labels = LabelSet(x='Quarters', y='Sales', text='Years', source = source_labels,
                  x_offset= -5, y_offset=5, text_font_size = '7pt')
p.add_layout(labels)

show(p)