Dear all,
I am using a data table for show values in bokeh server application.
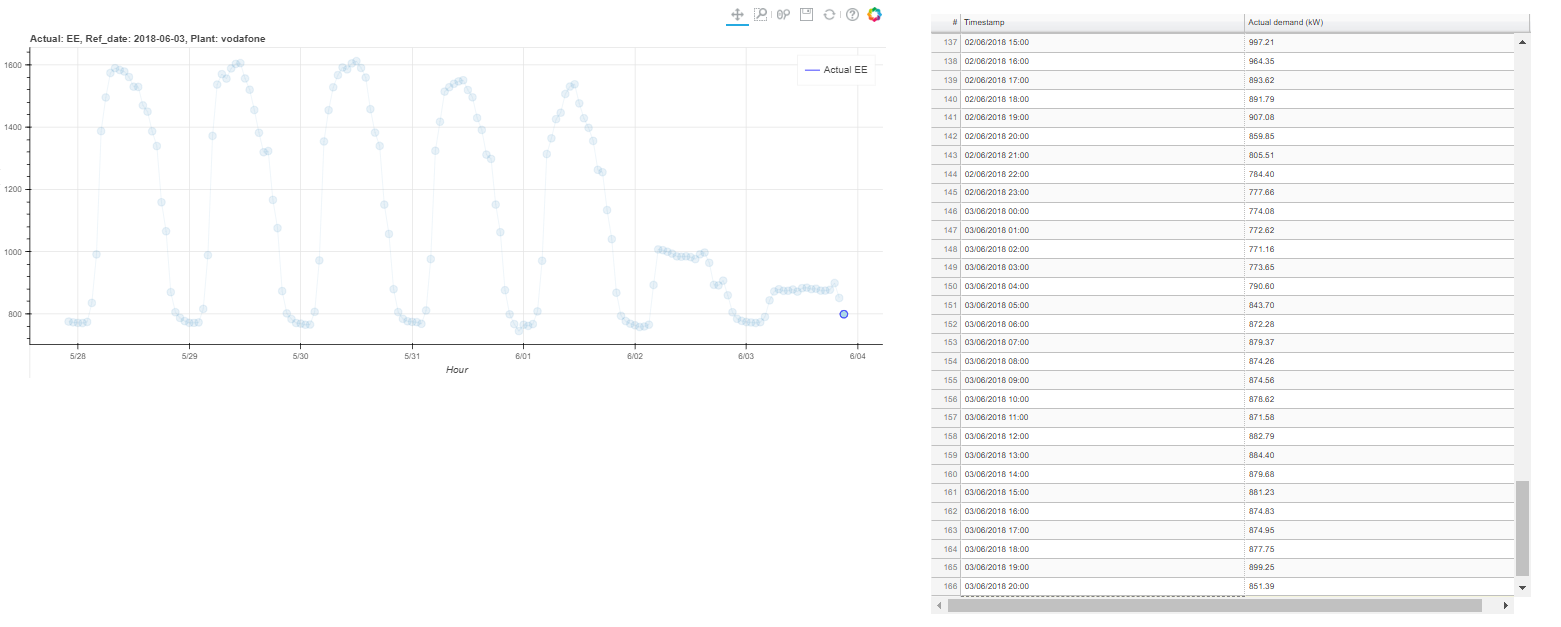
How you can see from my screen, last poin in the data table is not visible.
Is there any suggestion about my issue?
Best regards,
Luca
Dear all,
I am using a data table for show values in bokeh server application.
How you can see from my screen, last poin in the data table is not visible.
Is there any suggestion about my issue?
Best regards,
Luca
Hi,
Please always provide:
* version information (bugs come and go, maybe this is fixed in a newer version)
* code to reproduce
Without these, it is very hard to offer specific help.
Thanks,
Bryan
On Jun 4, 2018, at 06:36, [email protected] wrote:
Dear all,
I am using a data table for show values in bokeh server application.
How you can see from my screen, last poin in the data table is not visible.Is there any suggestion about my issue?
Best regards,
Luca
--
You received this message because you are subscribed to the Google Groups "Bokeh Discussion - Public" group.
To unsubscribe from this group and stop receiving emails from it, send an email to [email protected].
To post to this group, send email to [email protected].
To view this discussion on the web visit https://groups.google.com/a/continuum.io/d/msgid/bokeh/92962f1b-8b7e-45bd-a8cc-2586efd2b5c3%40continuum.io\.
For more options, visit https://groups.google.com/a/continuum.io/d/optout\.
<Cattura.PNG>
Hi Bryan,
thanks for your help.
version information: bokeh 0.12.16 py36_0
Data are coming from a database and is a dataframe like this:
import pandas as pd
import numpy as np
from datetime import datetime, timedelta
date_today = pd.to_datetime(datetime.now().strftime(’%Y-%m-%d %H:00’))
days = pd.date_range(date_today, date_today + timedelta(7), freq=‘H’)
np.random.seed(seed=1111)
data = np.random.randint(1, high=100, size=len(days))
df = pd.DataFrame({‘index’: days, ‘EE’: data})
df = df.set_index(‘index’)
df[‘hour’] = [i.hour for i in df.index]
target = ‘EE’
plant = ‘plant_1’
ref_date = datetime.datetime.now().date()
I generate a figure, a datatable and a button for export and I append to gridplot.
Code that made table and chart is the following:
def plot_actuals(data, target, ref_date, plant):

    source_1 = ColumnDataSource(
        data=dict(date=data.index, date_str=data.index.map(lambda x: x.strftime('%Y-%m-%d %H:%M')),
                  EE=data['EE'].values))

    p = figure(title='Actual: {}, Ref_date: {}, Plant: {}'.format(target, ref_date, plant),
               x_axis_type='datetime', plot_width=1200, plot_height=500,
               x_axis_location='below', toolbar_location='above', toolbar_sticky=False)

    p.line(x='date', y='EE', source=source_1, color='blue', legend='Actual {}'.format(target))
    p.circle(x='date', y='EE', source=source_1, line_color="blue", fill_color="lightblue", size=10)

    p.yaxis.axis_label = 'Demand (kW)'
    p.xaxis.axis_label = 'Hour'

    datefmt = bokeh.models.DateFormatter(format="%d/%m/%Y %H:%M")
    hfmt = bokeh.models.NumberFormatter(format="0.00")
    columns = [
        TableColumn(field="date", title="Timestamp", formatter=datefmt),
        TableColumn(field="EE", title="Actual demand (kW)", formatter=hfmt)]
    data_table = DataTable(source=source_1, columns=columns, width=800, height=800,
                           editable=True, selectable=True)

    callback = CustomJS(args=dict(source=source_1), code="""
                var data = source.data;
                var filetext = 'date_str,EE\\n';
                for (var i = 0; i < data['date_str'].length; i++) {
                    var currRow = [data['date_str'][i].toString(),
                                   data['EE'][i].toString().concat('\\n')];

                    var joined = currRow.join();
                    filetext = filetext.concat(joined);
                }

                var filename = 'data_result.csv';
                var blob = new Blob([filetext], { type: 'text/csv;charset=utf-8;'});

                //addresses IE
                if (navigator.msSaveBlob) {
                    navigator.msSaveBlob(blob, filename);
                } else {
                    var link = document.createElement("a");
                    link = document.createElement('a')
                    link.href = URL.createObjectURL(blob);
                    link.download = filename
                    link.target = "_blank";
                    link.style.visibility = 'hidden';
                    link.dispatchEvent(new MouseEvent('click'))
                }
            """)
    download_b = Button(label="Export csv", button_type="success", callback=callback, width=300, height=100)

    return p, data_table, download_b
Hi Luca,
Sorry, when I saw "code to reproduce", I mean a *complete* script, that I can immediately run to investigate, without any modifications or additions or changes.
Thanks,
Bryan
On Jun 4, 2018, at 09:10, Luca Nicoli <[email protected]> wrote:
Hi Bryan,
thanks for your help.
version information: bokeh 0.12.16 py36_0
Data are coming from a database and is a dataframe like this:
import pandas as pd
import numpy as np
from datetime import datetime, timedeltadate_today = pd.to_datetime(datetime.now().strftime('%Y-%m-%d %H:00'))
days = pd.date_range(date_today, date_today + timedelta(7), freq='H')
np.random.seed(seed=1111)
data = np.random.randint(1, high=100, size=len(days))
df = pd.DataFrame({'index': days, 'EE': data})
df = df.set_index('index')
df['hour'] = [i.hour for i in df.index]target = 'EE'
plant = 'plant_1'
ref_date = datetime.datetime.now().date()I generate a figure, a datatable and a button for export and I append to gridplot.
Code that made table and chart is the following:
def plot_actuals(data, target, ref_date, plant):
source_1 = ColumnDataSource(
data=dict(date=data.index, date_str=data.index.map(lambda x: x.strftime('%Y-%m-%d %H:%M')),
EE=data['EE'].values))p = figure(title='Actual: {}, Ref_date: {}, Plant: {}'.format(target, ref_date, plant),
x_axis_type='datetime', plot_width=1200, plot_height=500,
x_axis_location='below', toolbar_location='above', toolbar_sticky=False)p.line(x='date', y='EE', source=source_1, color='blue', legend='Actual {}'.format(target))
p.circle(x='date', y='EE', source=source_1, line_color="blue", fill_color="lightblue", size=10)p.yaxis.axis_label = 'Demand (kW)'
p.xaxis.axis_label = 'Hour'datefmt = bokeh.models.DateFormatter(format="%d/%m/%Y %H:%M")
hfmt = bokeh.models.NumberFormatter(format="0.00")
columns = [
TableColumn(field="date", title="Timestamp", formatter=datefmt),
TableColumn(field="EE", title="Actual demand (kW)", formatter=hfmt)]
data_table = DataTable(source=source_1, columns=columns, width=800, height=800,
editable=True, selectable=True)callback = CustomJS(args=dict(source=source_1), code="""
var data = source.data;
var filetext = 'date_str,EE\\n';
for (var i = 0; i < data['date_str'].length; i++) {
var currRow = [data['date_str'][i].toString(),
data['EE'][i].toString().concat('\\n')];var joined = currRow.join();
filetext = filetext.concat(joined);
}var filename = 'data_result.csv';
var blob = new Blob([filetext], { type: 'text/csv;charset=utf-8;'});//addresses IE
if (navigator.msSaveBlob) {
navigator.msSaveBlob(blob, filename);
} else {
var link = document.createElement("a");
link = document.createElement('a')
link.href = URL.createObjectURL(blob);
link.download = filename
link.target = "_blank";
link.style.visibility = 'hidden';
link.dispatchEvent(new MouseEvent('click'))
}
""")
download_b = Button(label="Export csv", button_type="success", callback=callback, width=300, height=100)return p, data_table, download_b
--
You received this message because you are subscribed to the Google Groups "Bokeh Discussion - Public" group.
To unsubscribe from this group and stop receiving emails from it, send an email to [email protected].
To post to this group, send email to [email protected].
To view this discussion on the web visit https://groups.google.com/a/continuum.io/d/msgid/bokeh/903fe523-dfdd-4726-b711-949649f7b1e6%40continuum.io\.
For more options, visit https://groups.google.com/a/continuum.io/d/optout\.