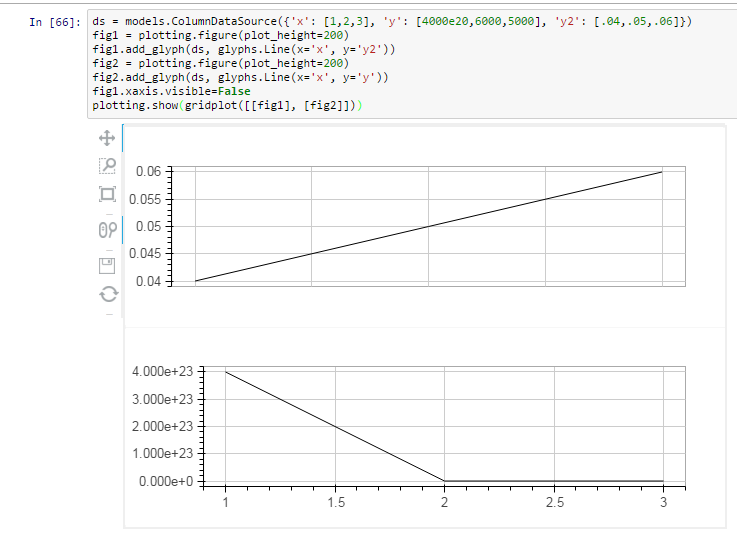
Is there a way to layout multiple pots on top of each other so that the y axes align. I find that if the units of the 2 plots are different, then I get different sizes tick labels causing the plots to unalign. The example I’m showing is extreme but without the ability to line up plots stacking is of limited use.
Can I somehow force these plots into line or am I just doing the layout wrong?
We are already working on improved layout capability that will be in the next release after 0.11 on Jan 6th. In the mean time, I have had success by employing the following properties:
* plot.min_border_left, plot.min_border_top, etc.
* axis.major_label_orientation
Basically, rotate the tick labels so they take up less space, and also set the min border on both plots large enough to accommodate the largest expected tick on either plot.
Additionally, if necessary, you can exert control over the tick formatting itself if that helps:
Finally, for standalone documents in 0.11 it is possible to extend Bokeh with custom user-defined models, and this might also provide a mechanism, but I suspect it would be overkill.
We definitely look forward to offering much more sophisticated layout options (both on- and off-canvas) in the near future. It's been a priority for a long time, but there have been lots of priorities, and only a few of us to work on them.
Is there a way to layout multiple pots on top of each other so that the y axes align. I find that if the units of the 2 plots are different, then I get different sizes tick labels causing the plots to unalign. The example I'm showing is extreme but without the ability to line up plots stacking is of limited use.
Can I somehow force these plots into line or am I just doing the layout wrong?
On Monday, December 28, 2015 at 6:04:49 PM UTC-5, Bryan Van de ven wrote:
Tom,
We are already working on improved layout capability that will be in the next release after 0.11 on Jan 6th. In the mean time, I have had success by employing the following properties:
plot.min_border_left, plot.min_border_top, etc.
axis.major_label_orientation
Basically, rotate the tick labels so they take up less space, and also set the min border on both plots large enough to accommodate the largest expected tick on either plot.
Additionally, if necessary, you can exert control over the tick formatting itself if that helps:
Finally, for standalone documents in 0.11 it is possible to extend Bokeh with custom user-defined models, and this might also provide a mechanism, but I suspect it would be overkill.
We definitely look forward to offering much more sophisticated layout options (both on- and off-canvas) in the near future. It’s been a priority for a long time, but there have been lots of priorities, and only a few of us to work on them.
Is there a way to layout multiple pots on top of each other so that the y axes align. I find that if the units of the 2 plots are different, then I get different sizes tick labels causing the plots to unalign. The example I’m showing is extreme but without the ability to line up plots stacking is of limited use.
Can I somehow force these plots into line or am I just doing the layout wrong?
–Tom
–
You received this message because you are subscribed to the Google Groups “Bokeh Discussion - Public” group.
To unsubscribe from this group and stop receiving emails from it, send an email to [email protected].
I have a row of pie charts on top of a row of histograms. The first pie chart is left aligned with the histogram below it, but it has a smaller width than all the other pie charts.
I’m attaching a screenshot.
···
On Monday, 28 December 2015 23:36:12 UTC, Tom wrote:
Thanks! The min_border_left did the trick!
On Monday, December 28, 2015 at 6:04:49 PM UTC-5, Bryan Van de ven wrote:
Tom,
We are already working on improved layout capability that will be in the next release after 0.11 on Jan 6th. In the mean time, I have had success by employing the following properties:
plot.min_border_left, plot.min_border_top, etc.
axis.major_label_orientation
Basically, rotate the tick labels so they take up less space, and also set the min border on both plots large enough to accommodate the largest expected tick on either plot.
Additionally, if necessary, you can exert control over the tick formatting itself if that helps:
Finally, for standalone documents in 0.11 it is possible to extend Bokeh with custom user-defined models, and this might also provide a mechanism, but I suspect it would be overkill.
We definitely look forward to offering much more sophisticated layout options (both on- and off-canvas) in the near future. It’s been a priority for a long time, but there have been lots of priorities, and only a few of us to work on them.
Is there a way to layout multiple pots on top of each other so that the y axes align. I find that if the units of the 2 plots are different, then I get different sizes tick labels causing the plots to unalign. The example I’m showing is extreme but without the ability to line up plots stacking is of limited use.
Can I somehow force these plots into line or am I just doing the layout wrong?
–Tom
–
You received this message because you are subscribed to the Google Groups “Bokeh Discussion - Public” group.
To unsubscribe from this group and stop receiving emails from it, send an email to [email protected].
On Tuesday, 28 March 2017 00:19:19 UTC+1, Tommy Carstensen wrote:
I have the same problem with version 0.12.4.
I have a row of pie charts on top of a row of histograms. The first pie chart is left aligned with the histogram below it, but it has a smaller width than all the other pie charts.
I’m attaching a screenshot.
On Monday, 28 December 2015 23:36:12 UTC, Tom wrote:
Thanks! The min_border_left did the trick!
On Monday, December 28, 2015 at 6:04:49 PM UTC-5, Bryan Van de ven wrote:
Tom,
We are already working on improved layout capability that will be in the next release after 0.11 on Jan 6th. In the mean time, I have had success by employing the following properties:
plot.min_border_left, plot.min_border_top, etc.
axis.major_label_orientation
Basically, rotate the tick labels so they take up less space, and also set the min border on both plots large enough to accommodate the largest expected tick on either plot.
Additionally, if necessary, you can exert control over the tick formatting itself if that helps:
Finally, for standalone documents in 0.11 it is possible to extend Bokeh with custom user-defined models, and this might also provide a mechanism, but I suspect it would be overkill.
We definitely look forward to offering much more sophisticated layout options (both on- and off-canvas) in the near future. It’s been a priority for a long time, but there have been lots of priorities, and only a few of us to work on them.
Is there a way to layout multiple pots on top of each other so that the y axes align. I find that if the units of the 2 plots are different, then I get different sizes tick labels causing the plots to unalign. The example I’m showing is extreme but without the ability to line up plots stacking is of limited use.
Can I somehow force these plots into line or am I just doing the layout wrong?
–Tom
–
You received this message because you are subscribed to the Google Groups “Bokeh Discussion - Public” group.
To unsubscribe from this group and stop receiving emails from it, send an email to [email protected].