Can anyone help me understand how to use the new Jitter functionality for real categorical plots?
The only example I can find is at http://bokeh.pydata.org/en/latest/docs/gallery/jitter.html
That’s a toy example that hardcodes the categories along the x-axis.
p.circle(x={'value': 1, 'transform': Jitter(width=0.4)}, y=y1,
         color="navy", alpha=0.3)
What does it mean to pass a dictionary for ‘x’?
What are the other keys that can be defined in that dict?
The documentation says you can pass a DataSpecProperty, but that word is not defined.
If I try to mimic that example for real data, I have to deconstruct the plot into separate calls to fig.circle() for each categorical group.
As if that’s not bad enough, it still doesn’t really work because I can’t know which ‘value’ number maps to which category along the range of the x-axis.
So does anyone have a better example for Jitter?
from bokeh.plotting import figure, show
from bokeh.layouts import row
from bokeh.models.sources import ColumnDataSource
from bokeh.models.transforms import Jitter
from bokeh.models import Jitter
import pandas as pd
import numpy as np
df = pd.DataFrame.from_dict({
“model” : np.random.choice([‘a’, ‘b’, ‘c’, ‘d’], 50),
“omega” : range(50)
})
factors = list(df.model.unique())
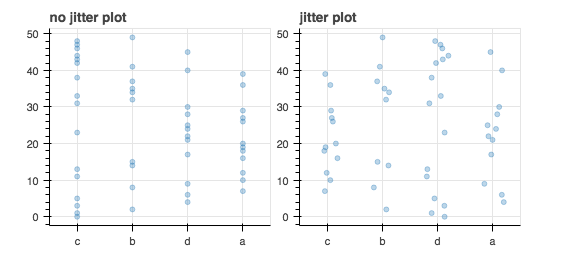
without jitter.
nojitter = figure(width=250, plot_height=250, title=“no jitter plot”, x_range=factors)
nojitter.toolbar_location = None
nojitter.circle(x=“model”, y=“omega”, source=ColumnDataSource(data=df),
alpha=0.3, size=5)
with jitter
jitter = figure(width=250, plot_height=250, title=“jitter plot”, x_range=factors)
jitter.toolbar_location = None
for i,(k,grp) in enumerate(df.groupby(“model”)):
jitter.circle(x={‘value’:i+1, ‘transform’: Jitter(width=0.4)}, y=“omega”,
source=ColumnDataSource(data=grp),
alpha=0.3, size=5)
p = row(nojitter, jitter)
show(p)
``