I totally realize that the details of layout elements can be beyond the scope of Bokeh itself, and often depends on the html/css framework in which Bokeh plots are rendered. However, I thought I would throw this out there for any suggestions.
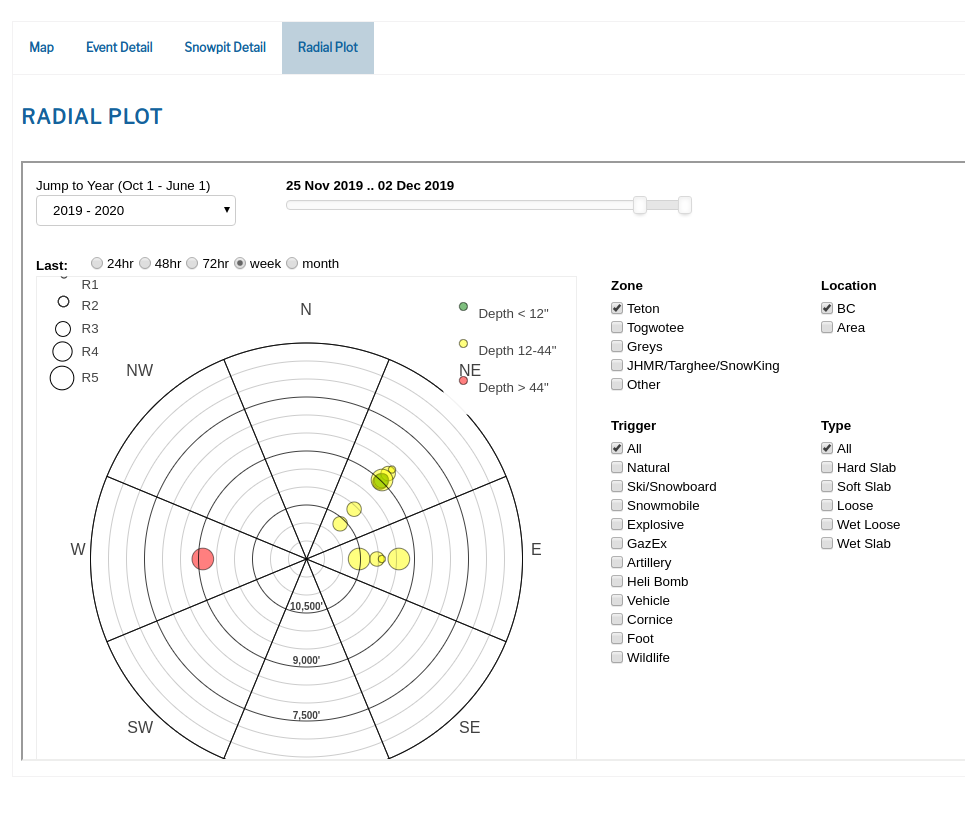
I have a radial plot figure I recently designed using Bokeh. You can see this here:
http://www.snowpacktracker.com/btac/event-radial-plot
The organization that we built this tool for is trying to embed this page directly into their website using an iframe (navigate to the “Radial Plot” tab):
http://jhavalanche.org/eventMap.php#event-radial
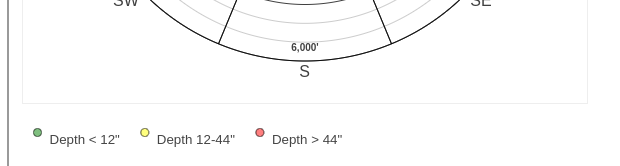
This seems to work fine, except the legend layouts get weird. Particularly the “Depth” legend in the upper-right. The legend seems to increase all the row heights for each legend item, so that it overlaps the figure. Testing with Chrome and Firefox, it only occurs with Chrome. The legend in the upper-left also has some minor layout issues that occur:
The relevant code to create the upper right “Depth” legend is:
  # This is a dummy glyph just to have consistent colors for a custom legend
  event_scatter_dummy = p.scatter(
    x=[1,2,3],
    y=[1,2,3],
    radius=0,
    fill_color=['green','yellow','red'], fill_alpha=0.5,
    line_color='black', line_alpha=0.5,
    name='event_scatter_dummy',
    )

  depth_legend = Legend(items=[
    LegendItem(label='Depth < 12"', renderers=[event_scatter_dummy], index=0),
    LegendItem(label='Depth 12-44"', renderers=[event_scatter_dummy], index=1),
    LegendItem(label='Depth > 44"', renderers=[event_scatter_dummy], index=2),
    ],
    label_text_baseline="middle",
    label_text_font_size="10pt",
    border_line_alpha = 0,
    )
  p.add_layout(depth_legend)
The only way I could figure out to add the upper-left “R-size” legend was to create separate legend instances and add them individually:
  # R-SIZE LEGEND
  # ============================================================================
  event_radius_dummy_1 = p.circle(
    1,1,
    radius=0,
    fill_alpha=0.0, line_color='black',
    name='event_radius_dummy_1'
    )

  # location is absolute location in screen coordinates
  # (pixels from the bottom-left corner)
  offset = 13
  event_legend1 = Legend(items=[
    LegendItem(label='R1', renderers=[event_radius_dummy_1])],
    location = (20, 553-offset),
    label_standoff = 10
  )

  event_legend2 = Legend(items=[
    LegendItem(label='R2', renderers=[event_radius_dummy_1])],
    location = (14, 532-offset),
    label_standoff = 5
  )

  event_legend3 = Legend(items=[
    LegendItem(label='R3', renderers=[event_radius_dummy_1])],
    location = (8, 507-offset),
    label_standoff = 0
  )

  event_legend4 = Legend(items=[
    LegendItem(label='R4', renderers=[event_radius_dummy_1])],
    location = (2, 479-offset),
    label_standoff = -5
  )

  event_legend5 = Legend(items=[
    LegendItem(label='R5', renderers=[event_radius_dummy_1])],
    location = (-4, 447-offset),
    label_standoff = -10
  )

  event_legend_list = [event_legend1,event_legend2,event_legend3,event_legend4,event_legend5]
  for legend in event_legend_list:
    p.add_layout(legend)

  size_list = [15,26,37,48,59]
  index_list = [1,2,3,4,5]

  for index, size in zip(index_list, size_list):
    p.legend[index].glyph_height = size
    p.legend[index].glyph_width = size
    p.legend[index].padding = 0
    p.legend[index].margin = 0
    p.legend[index].border_line_alpha = 0
    p.legend[index].background_fill_alpha = 0
    p.legend[index].label_text_baseline = "middle"
    p.legend[index].label_text_font_size = "10pt"
The code for the scatter plot figure is:
  cds = create_cds(event_data)

  p = figure(
      title="",
      name="scatter_fig",
      width=575, height=575,
      tools='',
  )

  p.toolbar.logo = None
  p.x_range = Range1d(-15, 15)
  p.y_range = Range1d(-15, 15)

  p.xgrid.visible = False
  p.ygrid.visible = False
  p.xaxis.visible = False
  p.yaxis.visible = False

  # Project data into polar coordinates
  # customjs from bryevdv (https://github.com/bokeh/bokeh/issues/657)
  polarx = CustomJSTransform(args=dict(source=cds), v_func='''
  const new_xs = new Array(source.data.elev_project_vectors.length)
  for(var i = 0; i < new_xs.length; i++) {
      new_xs[i] = source.data.elev_project_vectors[i] * Math.sin(source.data.elev_angles[i] )
  }
  return new_xs
  ''')

  polary = CustomJSTransform(args=dict(source=cds), v_func='''
  const new_ys = new Array(source.data.elev_project_vectors.length)
  for(var i = 0; i < new_ys.length; i++) {
      new_ys[i] = source.data.elev_project_vectors[i] * Math.cos(source.data.elev_angles[i] )
  }
  return new_ys
  ''')

  event_scatter = p.scatter(
    x=transform('elev_project_vectors', polarx),
    y=transform('elev_project_vectors', polary),
    radius='RadiusSize',
    fill_color='DepthClass', fill_alpha=0.5,
    line_color='black', line_alpha=0.5,
    name='event_scatter',
    source=cds)
I am currently using Bokeh 1.3.4, and we are providing the content to embed via iframe using a Heroku instance that is running the Bokeh server. The div for the iframe is:
<div class="cell ">
    <iframe src="https://invlabs-bokehserver.herokuapp.com/bkapp_event_radial_plot" scrolling="yes" style="width:100%;min-height:600px;margin:0 auto; z-index:1;"></iframe>
</div>
Any ideas or feedback much appreciated. Thanks again to the core Bokeh developers! We have found Bokeh to be a very powerful and high quality tool. When we get this web app polished and in a final form, we hope to include it in the Showcase page.
Thanks,
Patrick Wright