Hi Bryan,
Thank for your message, I have tried to do this but it seems I did something wrong.
p = figure(plot_height=768, plot_width=1024)
p_legend = figure(plot_height=300, plot_width=300) # adding another plot
....
legend = Legend(items=sorted(labels_metric), location=(10, -350))
p_legend.add_layout(legend)
controls = [metricGroup, metricName, curve_text, select_curve, rules_text, select_rule]
inputs = widgetbox(*controls, sizing_mode=‘fixed’)
l = layout([[inputs, p, p_legend]], sizing_mode=‘fixed’)
session.show(l)
in this case I can see only widgetbox, no plot at all... will think about your advise! Thank you!
<details class='elided'>
<summary title='Show trimmed content'>···</summary>
пятница, 17 марта 2017 г., 0:14:32 UTC+3 пользователь Bryan Van de ven написал:
> Hi,
>
>
>
> Not directly. Legends must go on the same HTML canvas as a Plot. They are not separate DOM elements which is the reason for what you are seing. A possible workaround, although clunky, would be to create a second plot that is completely empty except for a Legend that you create by hand to put in it. That second plot could go underneath the widgetbox.
>
>
>
> Thanks,
>
>
>
> Bryan
>
>
>
>
>
> > On Mar 16, 2017, at 16:11, Boris Gribkov <[email protected]> wrote:
>
> >
> > Hi All,
>
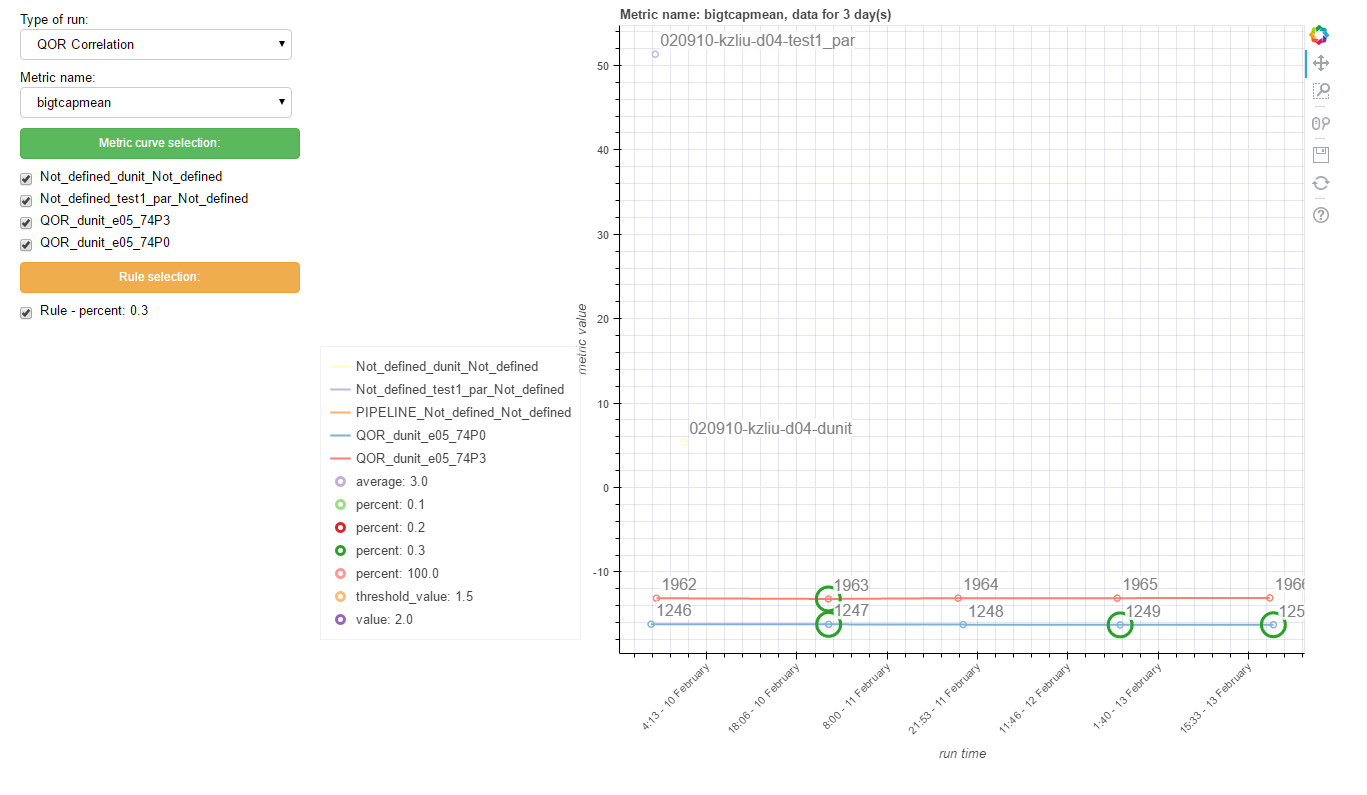
> > Please see the screenshot attached, I would like to put the legend directly below the widgetbox (not shifted), but it looks like plot and its legend is the single object (with a rectangular borders) and the widgetbox will be always shifted. Is it possible to find the way to overcome this issue?
> >
> > A piece of code which defines the plot:
>
> >
> > ....
>
> > p = figure(plot_height=768, plot_width=1024)
>
> > ....
>
> > legend = Legend(items=sorted(labels_metric), location=(10, -350))
>
> > p.add_layout(legend, 'left')
>
> > ....
>
> > controls = [metricGroup, metricName, curve_text, select_curve, rules_text, select_rule]
>
> > inputs = widgetbox(*controls, sizing_mode='fixed')
>
> > l = layout([[inputs, p]], sizing_mode='fixed')
>
> > session.show(l)
>
> >
> > Thank you!
>
> >
> >
> >
> >
> > --
> > You received this message because you are subscribed to the Google Groups "Bokeh Discussion - Public" group.
>
> > To unsubscribe from this group and stop receiving emails from it, send an email to [email protected].
>
> > To post to this group, send email to [email protected].
>
> > To view this discussion on the web visit [https://groups.google.com/a/continuum.io/d/msgid/bokeh/118f754b-22c0-444d-a247-adcaba368af9%40continuum.io](https://groups.google.com/a/continuum.io/d/msgid/bokeh/118f754b-22c0-444d-a247-adcaba368af9%40continuum.io).
>
> > For more options, visit [https://groups.google.com/a/continuum.io/d/optout](https://groups.google.com/a/continuum.io/d/optout).
>
>
>
</details>