Hello,
Many thanks for providing and advancing bokeh.
I am kind of new, but did work through the tutorial and did several searches.
I am wondering if there is as a way to create scroll-able legends in Bokeh as it is implemented in plotly.
Some posts imply to me that this does not seem to be possible in bokeh (as a new user I am only allowed two links. I prefer to use for my screenshot and the code and example data on google drive)
Situation: From a multi step analysis pipeline involving dimension reduction we obtain coordinates that can be used to create scatter plots with features representing many different biological entities. Many different entities means currently nearly one hundred and possibly in the future several thousands.
Steps done – I hope to be of relevance for my question here:
Read in coordinate and used p.circle for the making a scatter plot. Placing the legend outside of the plot area. Realizing that a subset of the entities is included in the legend:
simplified code from the jupyter noteboook:
(example data and entire jupyter notebook example under: https://drive.google.com/drive/folders/1BlBuXkvYnYQmsytCnw3TayLjlRUUiJK-?usp=sharing)
import pandas as pd
df=pd.read_excel(’/path/to/XYZ_UMAP.xlsx’)
header of df:
| Sentrix_ID | X | Y | annotation | |
|---|---|---|---|---|
| 0 | 5684819014_R03C02_betas_filtered.bin | -0.648644 | -1.952891 | GBM_G34 |
| 1 | 5684819014_R05C02_betas_filtered.bin | -2.463850 | 0.279426 | DMG_K27 |
| 2 | 5684819014_R06C02_betas_filtered.bin | -2.424760 | 0.403483 | DMG_K27 |
| 3 | 5684819013_R05C02_betas_filtered.bin | -2.217264 | 0.119362 | DMG_K27 |
plotting:
from bokeh.plotting import figure
from bokeh.io import output_file, show
from bokeh.models import ColumnDataSource, Legend
from bokeh.palettes import viridis
from bokeh.transform import linear_cmap
from bokeh.transform import factor_cmap
source2=ColumnDataSource(df)
NN=len(sorted(df.annotation.unique()))
color_map2 = factor_cmap(‘annotation’, viridis(NN), factors=sorted(df.annotation.unique()))
p2 = figure(title=“GBM reference case, viridis coloring”, sizing_mode=‘stretch_both’)
p2.add_layout(Legend(), ‘right’)#plot ledgend outisde of plot area
p2.circle(source=source2,
x=“X”,
y=“Y”,
fill_color=color_map2,
line_color=color_map2,
fill_alpha=1,
legend_field=“annotation”)
show(p2)
screenshot of the legend I did obtain:
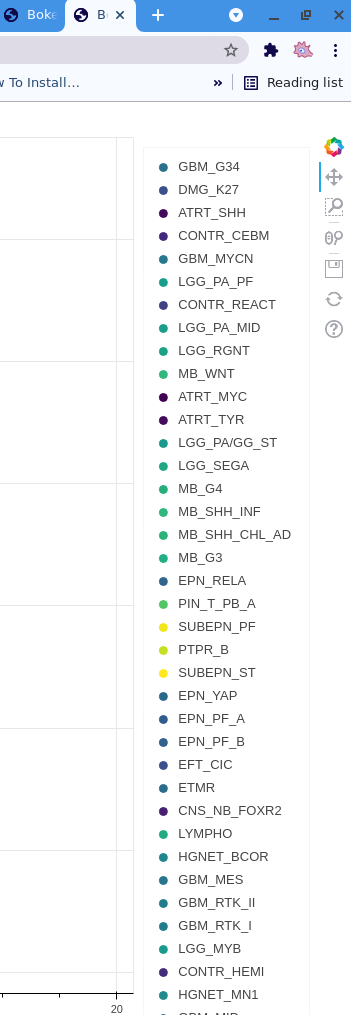
Example notebook and an example coordinate fileon goolge dirve - link above.
Please let me know if there is a way to make the legend scroll able.
Many thanks
Claus