Legend with two fields

I am trying to adapt an old code to a new version of Bokeh. The original one, published in Python for Bioinformatics is like this:

from bokeh.charts import Scatter, output_file, show
from pandas import DataFrame

df = DataFrame.from_csv('../../samples/fishdata.csv')

scatter = Scatter(df, x='PC1', y='PC2', color='feeds',
        marker='species', title=
        'Metabolic variations based on 1H NMR profiling of fishes',
        xlabel='Principal Component 1: 35.8%',
        ylabel='Principal Component 2: 15.1%')
scatter.legend.background_fill_alpha = 0.3
output_file('scatter.html')
show(scatter)

That produces the following plot:

Since bokeh.charts is deprecated, I had to modify the code to get the same result, here is the new code:

That produces a similar plot:

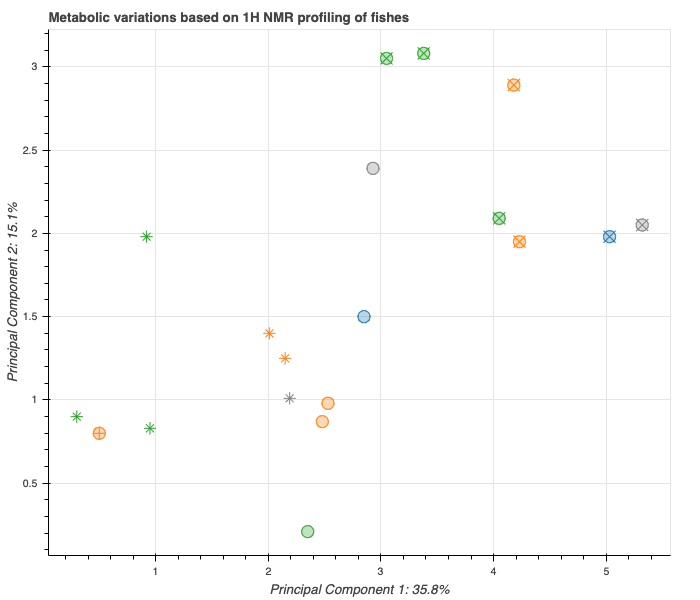
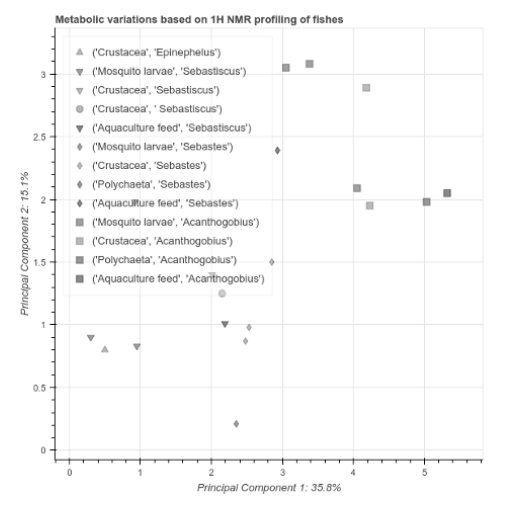
I wonder how to put a legend with both fields, as in the original image. Legend accepts only a string with the name one field, but I need to enter two. What can I do?

@sbassi please edit your post, the first image did not come through (and I don’t really remember what it might look liked, bokeh.charts was removed several years ago at this point).

It seems to be this one:

@sbassi What looks like two values is just a string created by something like str(('a', 'b')). What you want cannot be done directly ([FEATURE] Reflect bivariate scatter styles in legend · Issue #9867 · bokeh/bokeh · GitHub seems relevant), but there are two workarounds that I can see:

  • Create a CDS column feeds_and_species that just combines the feeds and species column values the way you want them to be displayed on the legend. Then just pass legend_field='feeds_and_species' into p.scatter
  • Create the whole legend manually. It will allow you to avoid having to create a special column, but it will require you to create bogus markers for each row. If you’re not sure how to do this, then definitely go with the other option

Hello, thanks for your post and for posting the picture (I was not allowed to post it since it triggered an anti spam property of this forum since it was my first post).
been trying to implement first option, with no success. I am no familiar with ColumnDataSource. You said “Create a CDS column…” and “Then just pass…”, but I understand that this CDS column should replace the source I am using now, that is the DataFrame, isn’t it?
Would you give me another advise?
Here is the date source: Py4Bio/fishdata.csv at master · Serulab/Py4Bio · GitHub
Best,
SB

Since it was my first post, the system didn’t allowed me to post it. Now I get: “You can’t post a link to that host”

Will post it no as a link, so bypass the filter (remove whitespace and add https):
git hub . com/ Serulab/ Py4Bio/ blob/ master/ samples/scatter.png

In your example, it would be something like

ds['feeds_and_species'] = df['feeds'] + ', ' + df['species']
...
p.scatter(..., legend_field='feeds_and_species')

In this case you’re not dealing with ColumnDataSource. But that’s only because Bokeh converts Pandas’ DataFrame to Bokeh’s ColumnDataSource implicitly when you pass it as source=ds.

1 Like

It worked!
Next post will publish the full code for reference if someone search for this in the future. Thank you again.

Here is the new code with all the changes:

from bokeh.plotting import figure, show, output_file
from bokeh.models.markers import marker_types
from bokeh.transform import factor_cmap, factor_mark
from pandas import read_csv

df = read_csv('../samples/fishdata.csv')
df['feeds_and_species'] = df['feeds'] + ', ' + df['species']

all_markers = [mt for mt in marker_types]
SPECIES = list(set(df['species']))
MARKERS = all_markers[:len(SPECIES)]
feeds = list(set(df['feeds']))
ttl = 'Metabolic variations based on 1H NMR profiling of fishes'
p = figure(plot_height=600, plot_width=700, title = ttl)
p.xaxis.axis_label = 'Principal Component 1: 35.8%'
p.yaxis.axis_label = 'Principal Component 2: 15.1%'
p.scatter('PC1', 'PC2', source=df, size=12, fill_alpha=0.3, 
          marker=factor_mark('species', MARKERS, SPECIES),
          color=factor_cmap('feeds', 'Category10_3', feeds),
          legend_field='feeds_and_species')
p.legend.location = 'top_left'
p.legend.click_policy = 'hide'
output_file('scatter.html')
show(p)
2 Likes