Hi All, I’m trying a plot with circle and line glyphs. I have added HoverTool to circle. When hovering on circle point, the line disappears but appears back when the hover disappears. Is there any workaround ( (using 3.1.0 BokehJs version)
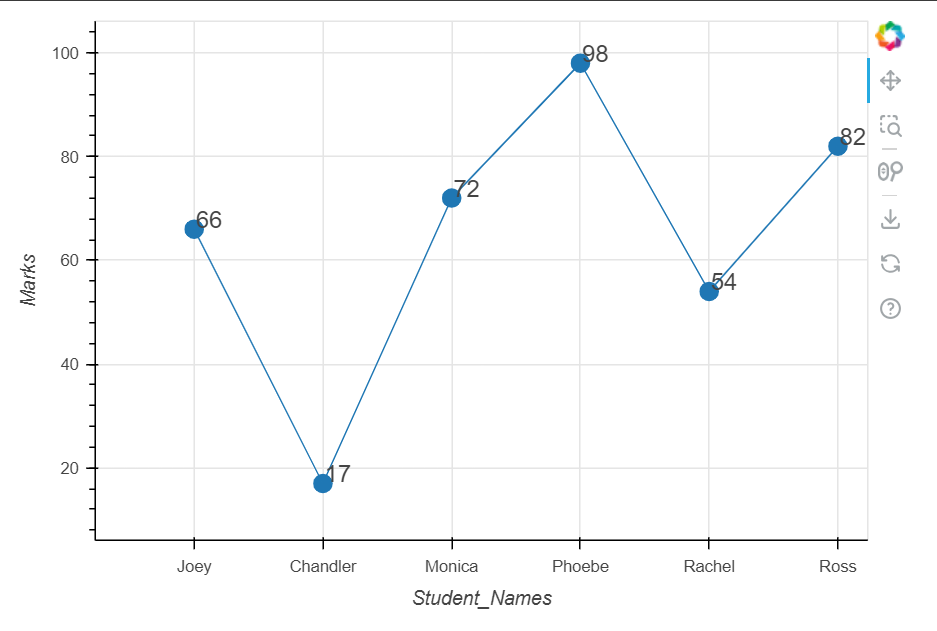
This is the plot
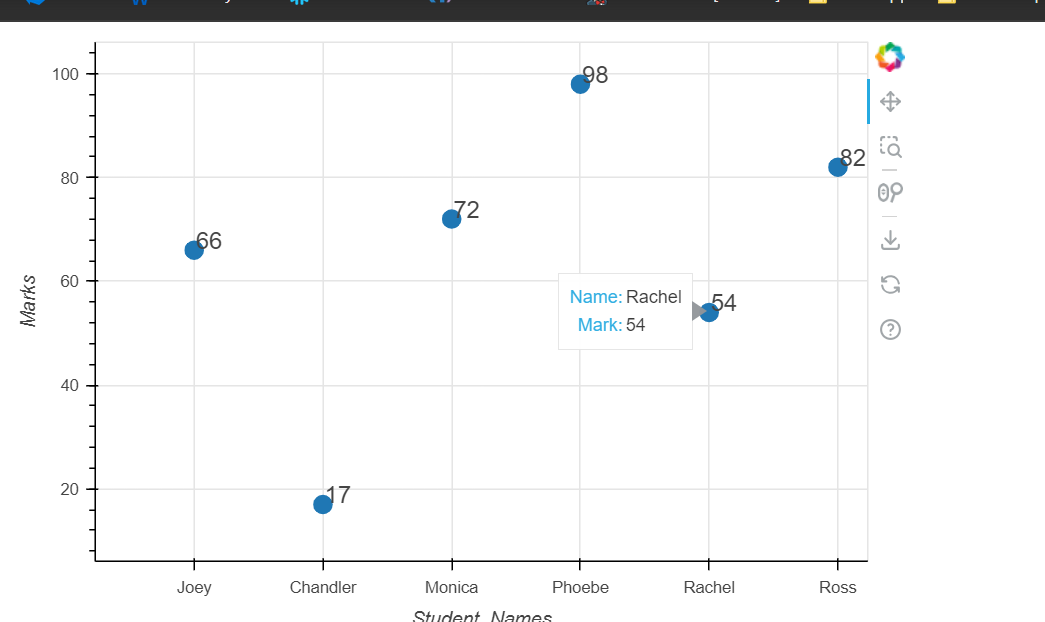
The line disappearing when hovering circle point
Minimal Reproducible Code
<!doctype html>
<html lang="en">
<head>
<meta charset="utf-8">

<script type="text/javascript" src="https://cdn.bokeh.org/bokeh/release/bokeh-3.1.0.min.js"></script>
<script type="text/javascript" src="https://cdn.bokeh.org/bokeh/release/bokeh-gl-3.1.0.min.js"></script>
<script type="text/javascript" src="https://cdn.bokeh.org/bokeh/release/bokeh-widgets-3.1.0.min.js"></script>
<script type="text/javascript" src="https://cdn.bokeh.org/bokeh/release/bokeh-tables-3.1.0.min.js"></script>
<script type="text/javascript" src="https://cdn.bokeh.org/bokeh/release/bokeh-mathjax-3.1.0.min.js"></script>
<script type="text/javascript" src="https://cdn.bokeh.org/bokeh/release/bokeh-api-3.1.0.min.js"></script>
<script type="text/javascript" src="https://cdn.bokeh.org/bokeh/release/bokeh-api-3.1.0.min.js"></script>

<script>
//The order of CSS and JS imports above is important.

// create a data source to hold data
var source = new Bokeh.ColumnDataSource({
    data: {
	marks: [66, 17, 72, 98, 54, 82],
    roll_no: [0, 1, 2, 3, 4, 5],
    names: ['Joey', 'Chandler', 'Monica',
    'Phoebe', 'Rachel', 'Ross']
	}
	});

var xdr = ['Joey', 'Chandler', 'Monica',
    'Phoebe', 'Rachel', 'Ross'];

var ydr = new Bokeh.Range1d({
            start: 0,
            end: 100
});

// Creating an empty figure
const p = Bokeh.Plotting.figure({
    height: 400,
    width: 600,
	x_range: xdr,
	y_range: ydr
});

// Labelling the X-Axis
p.xaxis.axis_label = 'Student_Names'

// Labelling the Y-Axis
p.yaxis.axis_label = 'Marks'


// Using LabelSet, we are labelling each of the
//points with names created in source
var circle = p.circle({ field: "names" },
        { field: "marks" },
        {
            source: source,
            size: 12
        });

var line = p.line({ field: "names" },
        { field: "marks" },
        {
            source: source,
        });


var circle_tooltip = [
	["Name", '@names'],
	["Mark", '@marks']
];

var hover = new Bokeh.HoverTool({
	renderers: [circle],
	tooltips: circle_tooltip,
	toggleable: false
});
p.add_tools(hover);
// Using LabelSet, we are labelling each of the
// points with names created in source
var labels = new Bokeh.LabelSet( { x : { field: "names" },
       y: { field: "marks" },  text: {field :'marks' },
                  x_offset: 1, y_offset: 1, source: source} );

//Adding that label to our figure
p.add_layout(labels);

//Showing the above plot
const plt = Bokeh.Plotting;

plt.show(p);


</script>
</head>

<body>

</body>

</html>