Hi,
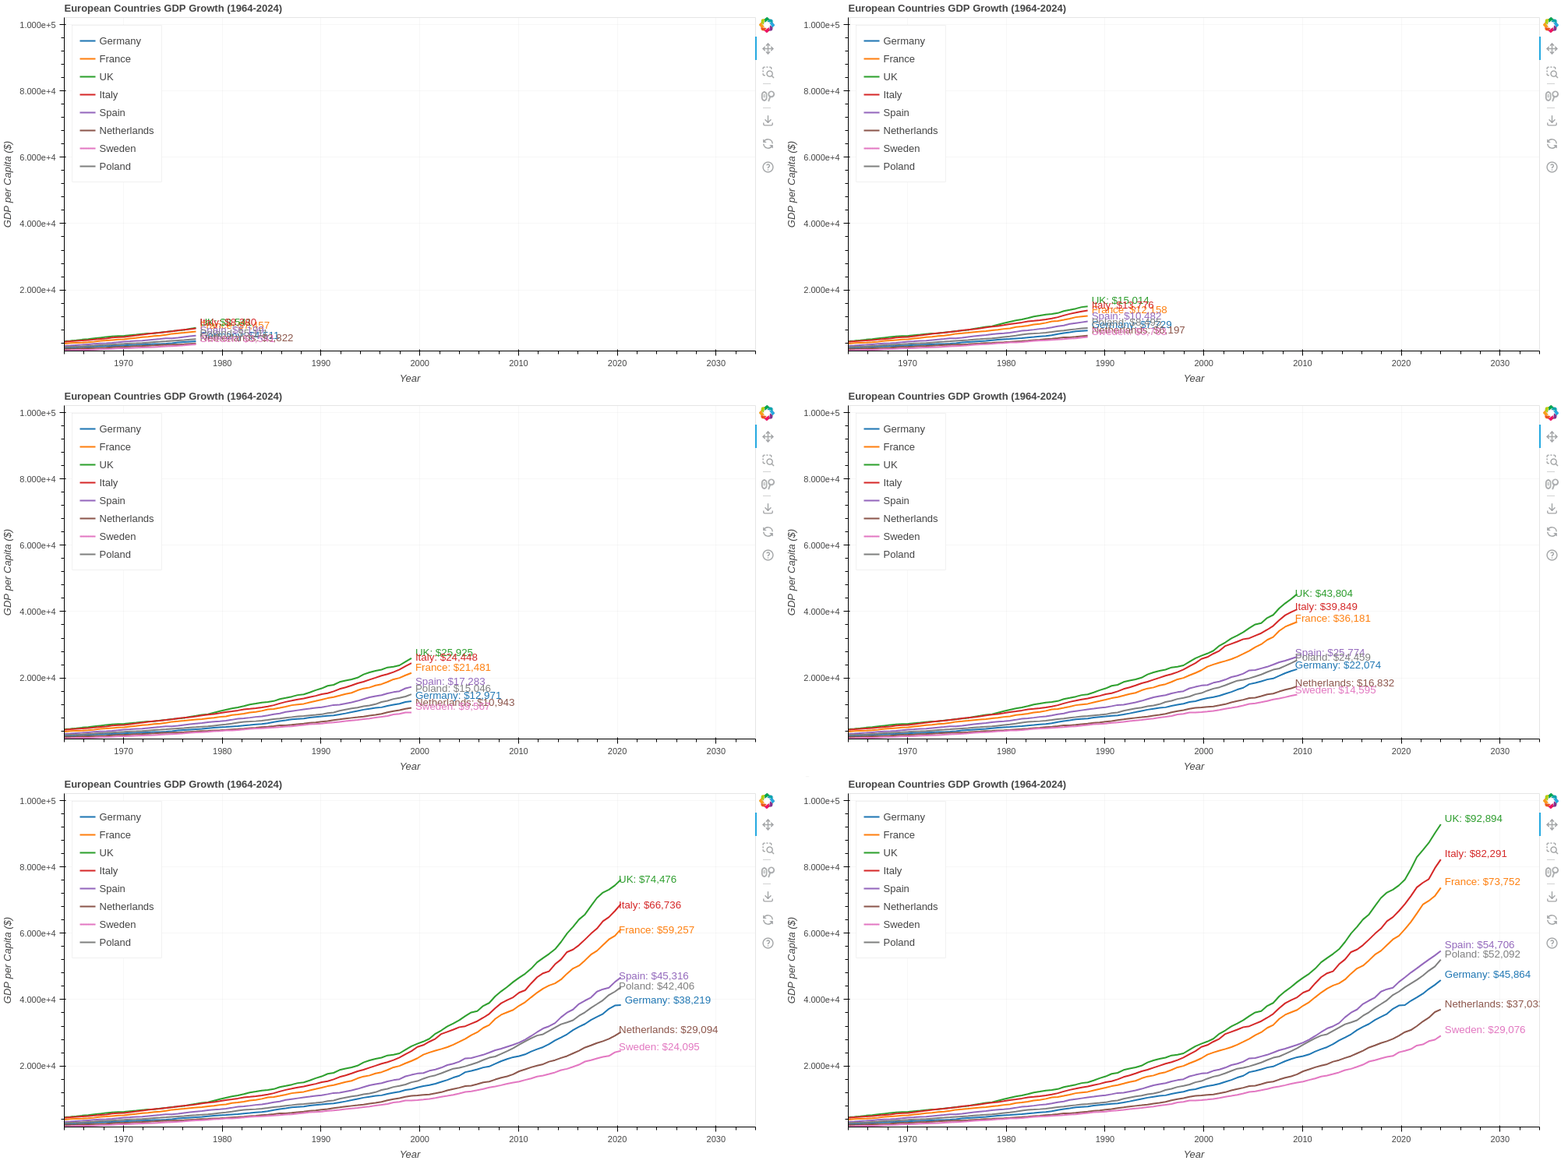
An example of line race.

from bokeh.plotting import figure, curdoc
from bokeh.models import ColumnDataSource, Label
import numpy as np

# Generate data for multiple countries
countries = ['Germany', 'France', 'UK', 'Italy', 'Spain', 'Netherlands', 'Sweden', 'Poland']
years = np.linspace(1964, 2024, 100)
data = {}

# Generate random growth curves for each country
np.random.seed(42)
for country in countries:
    base = np.random.uniform(1000, 5000)
    growth = np.random.normal(0.03, 0.01, len(years))
    values = [base]
    for rate in growth:
        values.append(values[-1] * (1 + rate))
    data[country] = np.array(values[:-1])

# Calculate max values for fixed axes
max_y = max(max(data[country]) for country in countries)
min_y = min(min(data[country]) for country in countries)

# Create initial data with first point
source = ColumnDataSource({
    'x': [years[0]],
    **{country: [data[country][0]] for country in countries}
})

# Create the plot
p = figure(title="European Countries GDP Growth (1964-2024)",
           x_axis_label='Year', y_axis_label='GDP per Capita ($)',
           width=1000, height=500,
           x_range=(years[0], years[-1] + 10),
           y_range=(min_y * 0.9, max_y * 1.1))

# Add lines and labels for each country
colors = ['#1f77b4', '#ff7f0e', '#2ca02c', '#d62728', '#9467bd', '#8c564b', '#e377c2', '#7f7f7f']
lines = {}
labels = {}

for country, color in zip(countries, colors):
    # Add line
    lines[country] = p.line('x', country, line_color=color, legend_label=country,
                           line_width=2, source=source)

    # Add label
    labels[country] = Label(
        x=years[0], y=data[country][0],
        text=f"{country}: ${int(data[country][0]):,}",
        text_color=color,
        text_font_size='10pt',
        x_offset=5, y_offset=0
    )
    p.add_layout(labels[country])

# Style the plot
p.legend.click_policy = "hide"
p.legend.location = "top_left"
p.grid.grid_line_alpha = 0.3

# Animation counter
counter = 1

def animate():
    global counter
    if counter >= len(years):
        return

    # Update data
    new_data = {
        'x': years[:counter+1].tolist(),
        **{country: data[country][:counter+1].tolist() for country in countries}
    }
    source.data = new_data

    # Update labels
    for country in countries:
        current_value = data[country][counter]
        labels[country].x = years[counter]
        labels[country].y = current_value
        labels[country].text = f"{country}: ${int(current_value):,}"

    counter += 1

# Add periodic callback
doc = curdoc()
doc.add_periodic_callback(animate, 100)  # 100ms between frames
doc.add_root(p)
bokeh serve --show app.py