I’m trying to graph some lines.
When I graph this set of data:
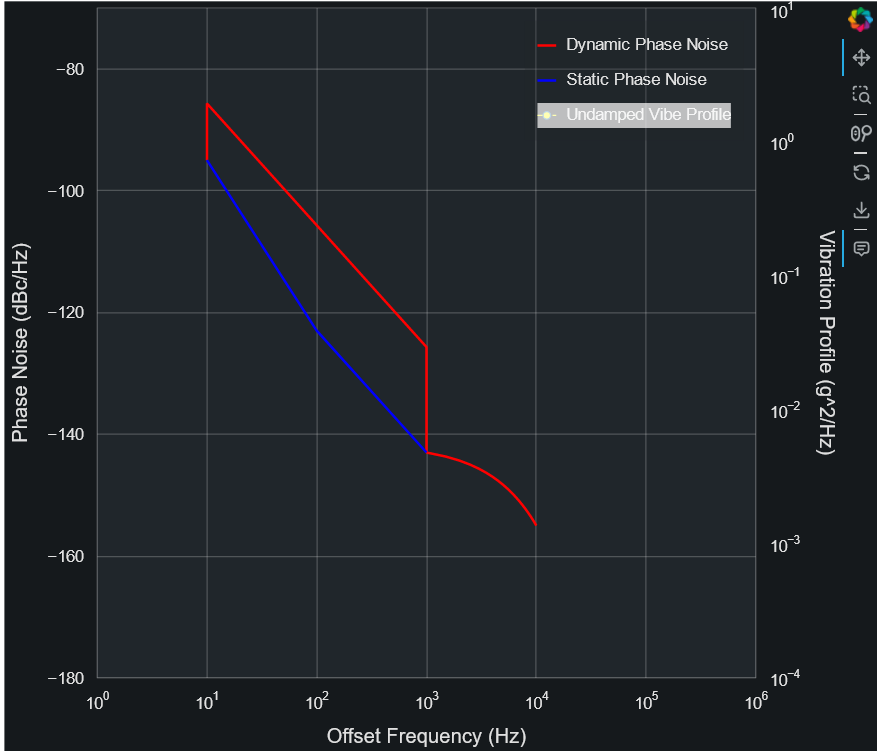
data: { x: [10, 100, 1000], y: [-95, -123, -143]}
I get this plot:

This is the correct plot, the blue line is straight as expected
The red line follows the blue line exactly until it branches off at certain values (eg. x = 20)
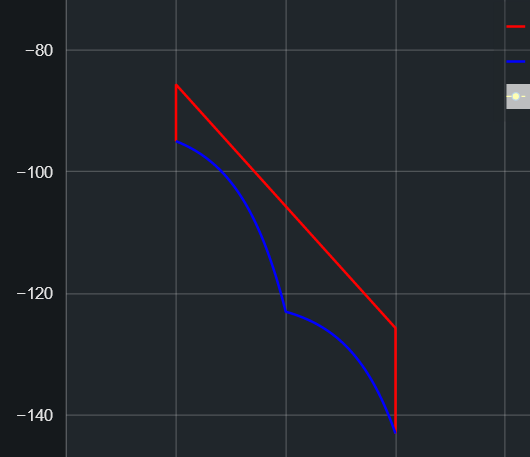
I am simply using point-intercept formula (y = mx + b) to get the equation of the segment of a line, then using that to get the y-values. But this causes an issue where the lines will show up as curved instead of straight.
This problem with curved lines is happening with both the blue and red lines.
I have verified that the points that I’m passing to bokeh are a straight line, and perfectly fit the equation of the line:
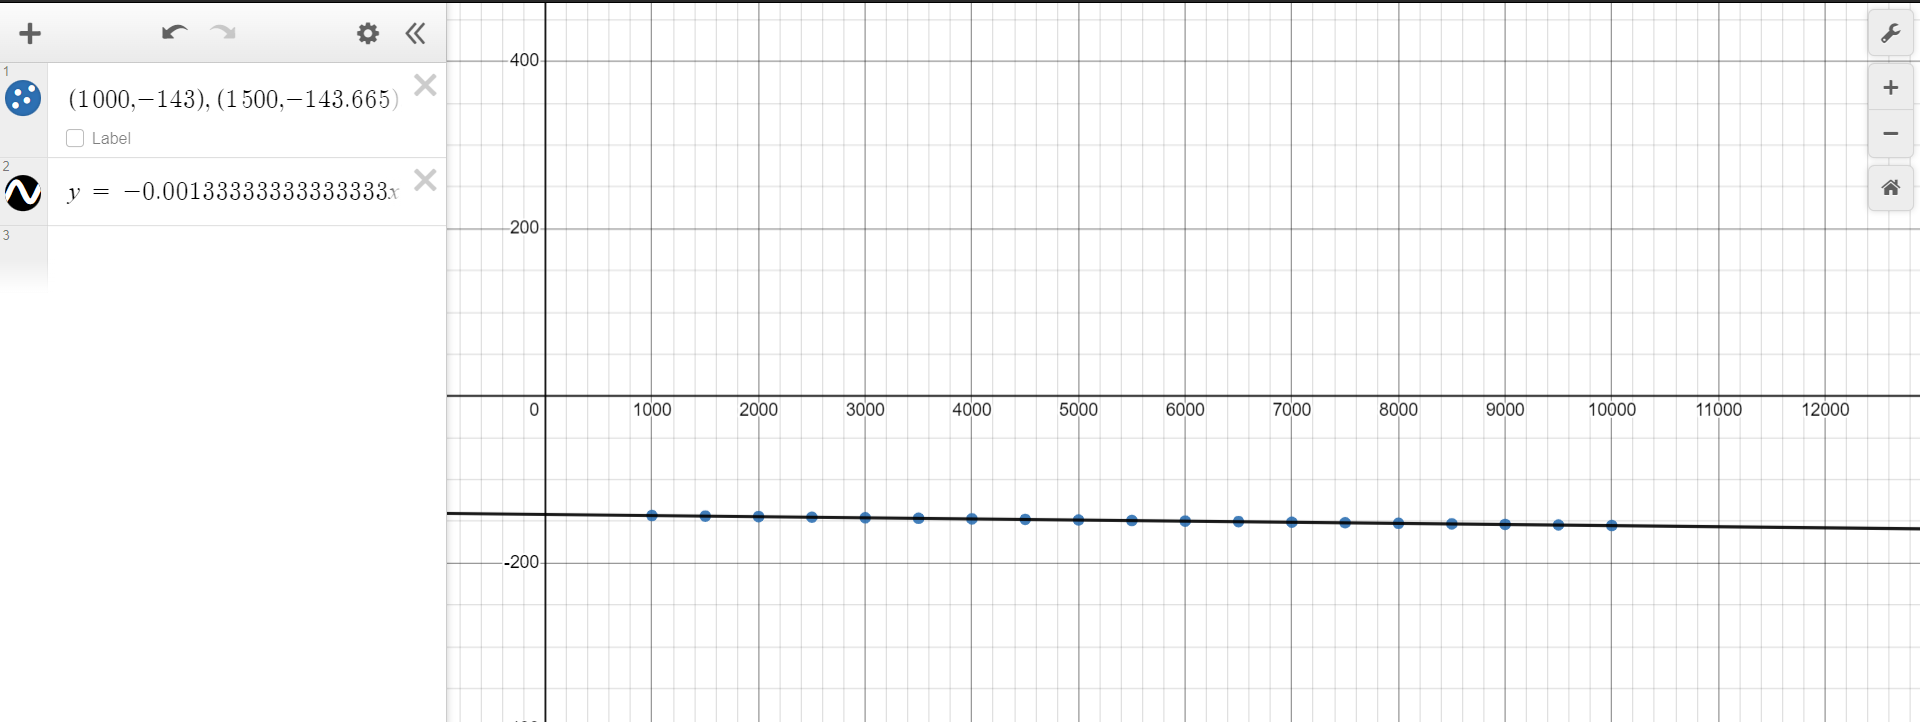
When the same points are graphed on a linear x-axis, it displays correctly as a straight line
This is parts of my code that generate the bokeh plot
 const source = new Bokeh.ColumnDataSource({
        //data: { x: Object.keys(PNVibe), y: Object.values(PNVibe) }
        data: { x: get_nth_column_of_array(PNVibe, 0), y: get_nth_column_of_array(PNVibe, 1) }
    });
    const plot = Bokeh.Plotting.figure({
        //title: 'Example of random data',
        tools: "pan,wheel_zoom,box_zoom,reset,save",
        toolbar_location: "right",
        toolbar_sticky: false,
        height: 600,
        width: 700,
        x_range: [1, 1000000],
        y_range: [-180, -70],
        x_axis_type: type_of_graph,
        x_axis_label: "Offset Frequency (Hz)",
        y_axis_label: "Phase Noise (dBc/Hz)",
        extra_y_ranges: { "y2_range": y2_range },
        extra_y_scales: { "y2_range": new Bokeh.LogScale() },
    });
    const line1 = plot.line({ field: "x" }, { field: "y" }, {
        source: source,
        line_width: 2,
        line_color: "red",
        legend_label: "Dynamic Phase Noise"
    });
Bokeh.Plotting.show(plot, "#graph-div");
The input to the data source is an array that looks like this: [x, y]
This data is generated with a javascript function that I can’t post
But here is a sample array:
var my_var = [ [10, -50.4145], [11, -51.561],...]
[ [ 10, -95 ], [ 10, -84.98593739 ], [ 11, -85.71292515 ], [ 12, -86.36691533 ], [ 13, -86.95976049 ], [ 14, -87.50057866 ], [ 15, -87.99788598 ], [ 16, -88.45457326 ], [ 17, -88.87646926 ], [ 18, -89.26718438 ], [ 19, -89.62963294 ], [ 20, -89.96617279 ], [ 21, -90.27871116 ], [ 22, -90.56878589 ], [ 23, -90.83762861 ], [ 24, -91.08770415 ], [ 25, -91.3167619 ], [ 26, -91.5268837 ], [ 27, -91.71847773 ], [ 28, -91.89180925 ], [ 29, -92.04701598 ], [ 30, -92.18412012 ], [ 31, -92.30303749 ], [ 32, -92.40358434 ], [ 33, -92.48656114 ], [ 34, -92.54937894 ], [ 35, -92.59271367 ], [ 36, -92.61601233 ], [ 37, -92.61862856 ], [ 38, -92.59981952 ], [ 39, -92.55874192 ], [ 40, -92.4944473 ], [ 41, -92.40587743 ], [ 42, -92.29240225 ], [ 43, -92.15159885 ], [ 44, -91.98266818 ], [ 45, -91.78411753 ], [ 46, -91.55438831 ], [ 47, -91.29191498 ], [ 48, -90.99523103 ], [ 49, -90.66315259 ], [ 50, -90.29508802 ], [ 51, -89.89171363 ], [ 52, -89.45512255 ], [ 53, -88.99119011 ], [ 54, -88.51078827 ], [ 55, -88.03266014 ], [ 56, -87.58649702 ], [ 57, -87.21505177 ], [ 58, -86.97230591 ], [ 59, -86.91395984 ], [ 60, -87.08012072 ], [ 61, -87.47832724 ], [ 62, -88.08029639 ], [ 63, -88.8345483 ], [ 64, -89.68508789 ], [ 65, -90.58443338 ], [ 66, -91.49812208 ], [ 67, -92.40371951 ], [ 68, -93.28787982 ], [ 69, -94.14354511 ], [ 70, -94.96723353 ], [ 71, -95.75817139 ], [ 72, -96.51685979 ], [ 73, -97.244558 ], [ 74, -97.94290419 ], [ 75, -98.61368896 ], [ 76, -99.2587234 ], [ 77, -99.8797649 ], [ 78, -100.47874858 ], [ 79, -101.05670388 ], [ 80, -101.61532052 ], [ 81, -102.15591946 ], [ 82, -102.67971141 ], [ 83, -103.18780396 ], [ 84, -103.68120964 ], [ 85, -104.16085397 ], [ 86, -104.62758338 ], [ 87, -105.08258252 ], [ 88, -105.52575397 ], [ 89, -105.95814528 ], [ 90, -106.38035435 ], [ 91, -106.79293107 ], [ 92, -107.1963819 ], [ 93, -107.5911739 ], [ 94, -107.97773844 ], [ 95, -108.35647447 ], [ 96, -108.72824956 ], [ 97, -109.09241644 ], [ 98, -109.44978442 ], [ 99, -109.80064939 ], [ 100, -110.14528682 ], [ 110, -113.08894994 ], [ 120, -115.48620161 ], [ 130, -117.4448969 ], [ 140, -119.03674559 ], [ 150, -120.32697222 ], [ 160, -121.37285334 ], [ 170, -122.23129914 ], [ 180, -122.93493559 ], [ 190, -123.52444635 ], [ 200, -124.02783521 ], [ 210, -124.4665146 ], [ 220, -124.86487761 ], [ 230, -125.21852763 ], [ 240, -125.5443303 ], [ 250, -125.84886624 ], [ 260, -126.14612322 ], [ 270, -126.42169651 ], [ 280, -126.68729911 ], [ 290, -126.94502732 ], [ 300, -127.19648424 ], [ 310, -127.45241762 ], [ 320, -127.69481324 ], [ 330, -127.933879 ], [ 340, -128.17020991 ], [ 350, -128.4139488 ], [ 360, -128.64616259 ], [ 370, -128.87679595 ], [ 380, -129.10609761 ], [ 390, -129.33427081 ], [ 400, -129.57125803 ], [ 410, -129.79766091 ], [ 420, -130.02335372 ], [ 430, -130.24843264 ], [ 440, -130.47297846 ], [ 450, -130.7068926 ], [ 460, -130.93057468 ], [ 470, -131.15389804 ], [ 480, -131.37690486 ], [ 490, -131.60949317 ], [ 500, -131.83197619 ], [ 510, -132.0542366 ], [ 520, -132.27629785 ], [ 530, -132.49818041 ], [ 540, -132.7297873 ], [ 550, -132.95136741 ], [ 560, -133.17281577 ], [ 570, -133.39414452 ], [ 580, -133.62526202 ], [ 590, -133.84638505 ], [ 600, -134.06741692 ], [ 610, -134.28836514 ], [ 620, -134.50923641 ], [ 630, -134.73994501 ], [ 640, -134.96068139 ], [ 650, -135.18135682 ], [ 660, -135.40197563 ], [ 670, -135.63245573 ], [ 680, -135.85297376 ], [ 690, -136.07344561 ], [ 700, -136.29387413 ], [ 710, -136.51426191 ], [ 720, -136.74453004 ], [ 730, -136.96484384 ], [ 740, -137.18512318 ], [ 750, -137.40536979 ], [ 760, -137.63550624 ], [ 770, -137.85569242 ], [ 780, -138.0758501 ], [ 790, -138.29598046 ], [ 800, -138.51608456 ], [ 810, -138.74608566 ], [ 820, -138.96614014 ], [ 830, -139.18617091 ], [ 840, -139.40617866 ], [ 850, -139.63608632 ], [ 860, -139.85604977 ], [ 870, -140.07599182 ], [ 880, -140.29591294 ], [ 890, -140.51581348 ], [ 900, -140.74561502 ], [ 910, -140.96547506 ], [ 920, -141.18531535 ], [ 930, -141.40513607 ], [ 940, -141.62493738 ], [ 950, -141.85463839 ], [ 960, -142.07440066 ], [ 970, -142.29414371 ], [ 980, -142.51386756 ], [ 990, -142.74348856 ], [ 1000, -142.9631732 ], [ 1100, -143.10445206 ], [ 1200, -143.25157856 ], [ 1300, -143.38634152 ], [ 1400, -143.51961177 ], [ 1500, -143.65192508 ], [ 1600, -143.79358918 ], [ 1700, -143.92483778 ], [ 1800, -144.0557825 ], [ 1900, -144.19650164 ], [ 2000, -144.32707131 ], [ 2100, -144.4575227 ], [ 2200, -144.59787994 ], [ 2300, -144.72817436 ], [ 2400, -144.85841565 ], [ 2500, -144.98861522 ], [ 2600, -145.12877889 ], [ 2700, -145.25891919 ], [ 2800, -145.38903799 ], [ 2900, -145.52913729 ], [ 3000, -145.65922438 ], [ 3100, -145.78929952 ], [ 3200, -145.92936324 ], [ 3300, -146.0594202 ], [ 3400, -146.18947009 ], [ 3500, -146.31951399 ], [ 3600, -146.45955175 ], [ 3700, -146.58958624 ], [ 3800, -146.71961694 ], [ 3900, -146.85964355 ], [ 4000, -146.9896682 ], [ 4100, -147.11969036 ], [ 4200, -147.25970968 ], [ 4300, -147.38972779 ], [ 4400, -147.51974422 ], [ 4500, -147.64975916 ], [ 4600, -147.78977225 ], [ 4700, -147.91978472 ], [ 4800, -148.04979613 ], [ 4900, -148.18980615 ], [ 5000, -148.31981579 ], [ 5100, -148.44982468 ], [ 5200, -148.58983249 ], [ 5300, -148.71984008 ], [ 5400, -148.84984711 ], [ 5500, -148.97985363 ], [ 5600, -149.11985936 ], [ 5700, -149.24986501 ], [ 5800, -149.37987027 ], [ 5900, -149.51987489 ], [ 6000, -149.64987948 ], [ 6100, -149.77988377 ], [ 6200, -149.91988753 ], [ 6300, -150.04989131 ], [ 6400, -150.17989485 ], [ 6500, -150.30989818 ], [ 6600, -150.44990108 ], [ 6700, -150.57990403 ], [ 6800, -150.70990681 ], [ 6900, -150.84990922 ], [ 7000, -150.9799117 ], [ 7100, -151.10991404 ], [ 7200, -151.24991606 ], [ 7300, -151.37991815 ], [ 7400, -151.50992014 ], [ 7500, -151.63992202 ], [ 7600, -151.77992362 ], [ 7700, -151.90992531 ], [ 7800, -152.03992692 ], [ 7900, -152.17992827 ], [ 8000, -152.30992972 ], [ 8100, -152.4399311 ], [ 8200, -152.57993225 ], [ 8300, -152.7099335 ], [ 8400, -152.83993469 ], [ 8500, -152.96993582 ], [ 8600, -153.10993675 ], [ 8700, -153.23993777 ], [ 8800, -153.36993875 ], [ 8900, -153.50993954 ], [ 9000, -153.63994043 ], [ 9100, -153.76994127 ], [ 9200, -153.90994194 ], [ 9300, -154.03994271 ], [ 9400, -154.16994344 ], [ 9500, -154.29994414 ], [ 9600, -154.43994468 ], [ 9700, -154.56994531 ], [ 9800, -154.69994592 ], [ 9900, -154.83994637 ], [ 10000, -154.99994655 ], [ 10000, -155 ] ]
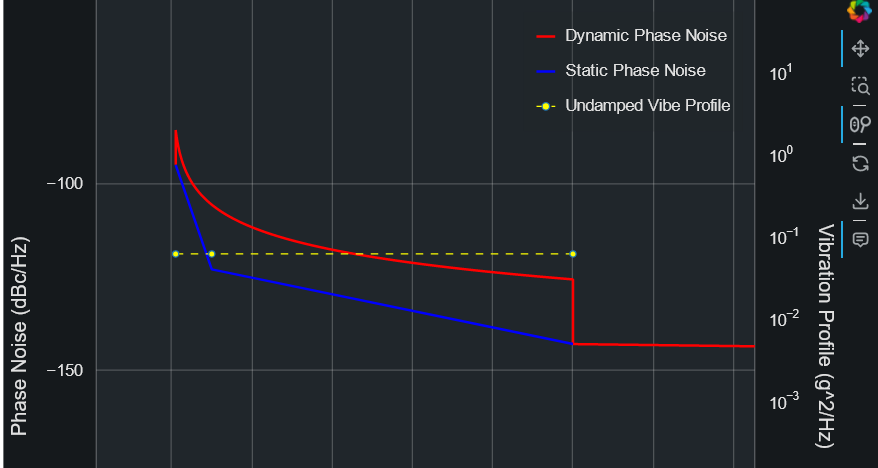
My first thought was that I had too many datapoints that the difference in y values was like 0.000000001 so the graph was displaying as a stepwise function (zooming in on curve showed stepwise).
But I’ve now tried reducing the number of data points a lot (previously it was 1 point per x, now its 1 point every like 10, or 100 x) and this still shows as a curved line (although not stepwsie now)
I’m using BokehJS version 3.0.3 (from cdnjs), with firefox version 110.0.1, I’ve also tried on Chrome.
How would I be able to make sure these lines are showing correctly?