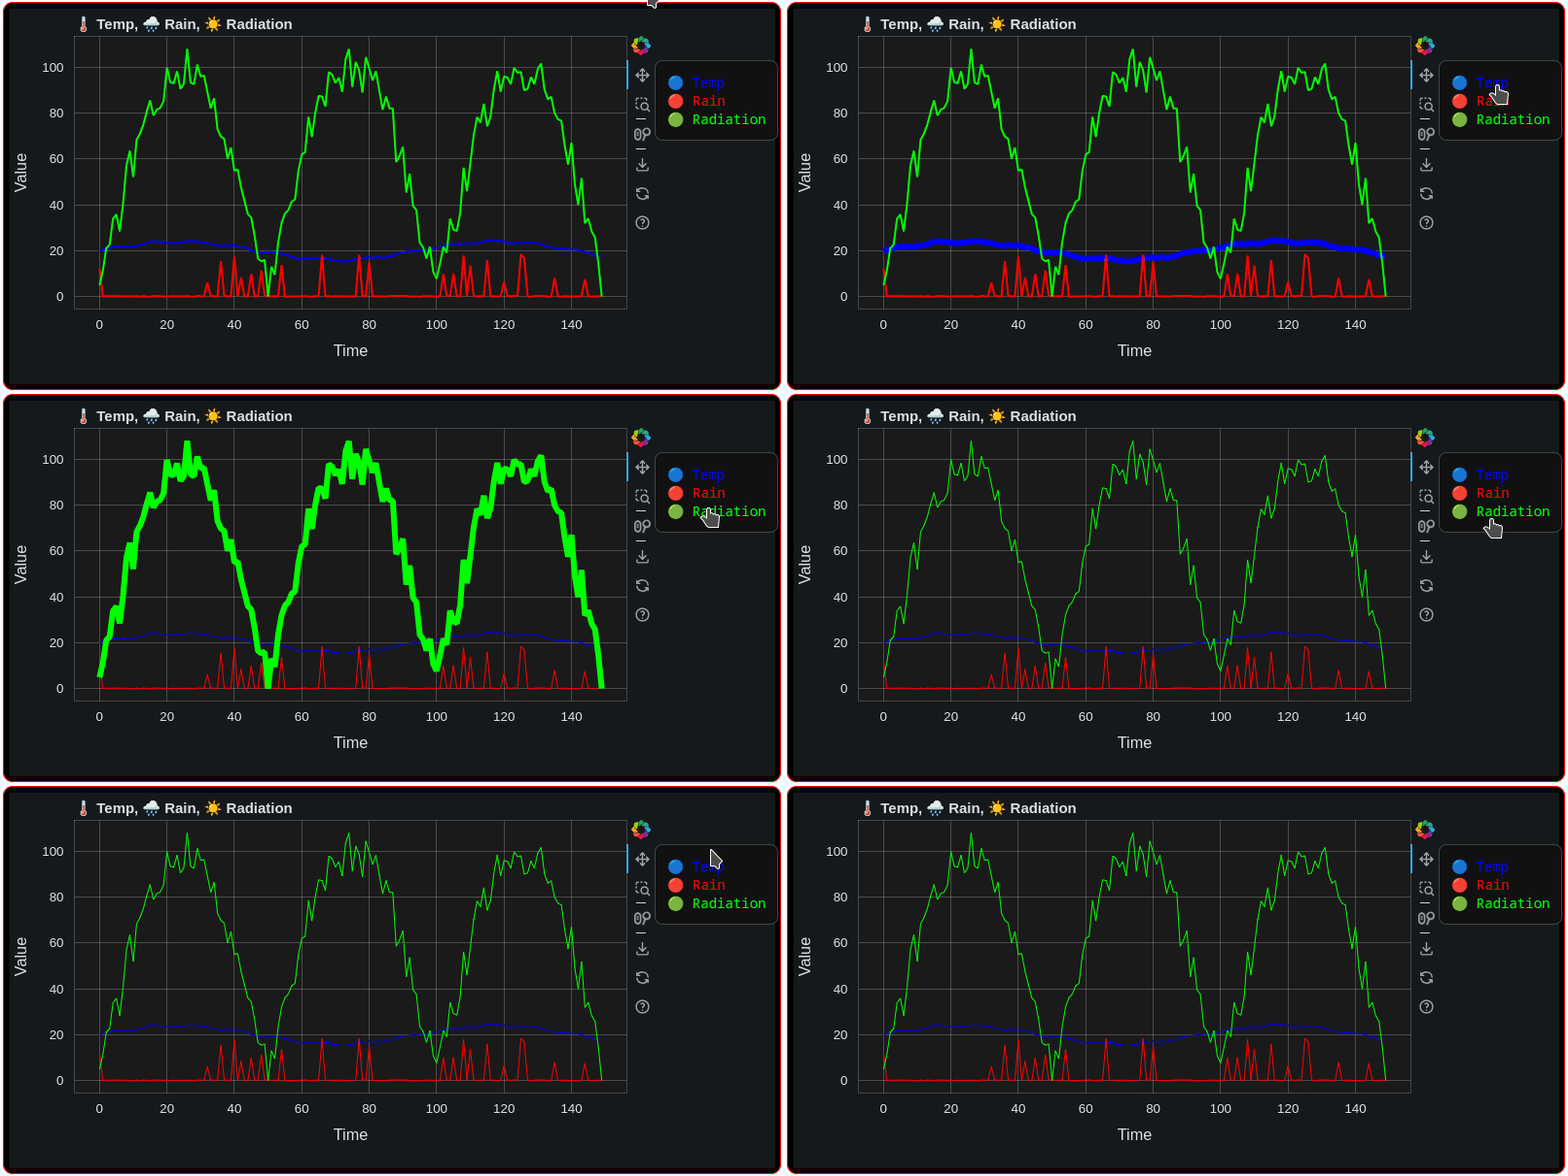
from bokeh.plotting import figure, show
from bokeh.models import ColumnDataSource, CustomJS
from bokeh.io import output_file
from bokeh.io import curdoc
curdoc().theme = 'night_sky'
import numpy as np

x = list(range(150))
temp = [20 + 4*np.sin(i / 15) + 0.5*np.sin(i / 2) + np.random.uniform(-0.3, 0.3) for i in x]
rain = [np.random.uniform(5, 20) if i % np.random.randint(5, 10) == 0 else np.random.uniform(0, 0.3) for i in x]
radiation = [max(0, 100 * np.sin((i % 50) / 50 * np.pi) + np.random.uniform(-10, 10)) for i in x]

source = ColumnDataSource(data=dict(x=x, temp=temp, rain=rain, radiation=radiation))

p = figure(title="🌡️ Temp, 🌧️ Rain, ☀️ Radiation", width=800, height=400,background_fill_color="#1a1a1a",)
p.xaxis.axis_label = "Time"
p.yaxis.axis_label = "Value"

# 📈 Lines
r_temp = p.line('x', 'temp', source=source, color="blue", line_width=2, name="temp")
r_rain = p.line('x', 'rain', source=source, color="red", line_width=2, name="rain")
r_rad = p.line('x', 'radiation', source=source, color="lime", line_width=2, name="radiation")

js = CustomJS(code="""
    function wait() {
        const doc = Bokeh.documents[0];
        const r1 = doc.get_model_by_name('temp');
        const r2 = doc.get_model_by_name('rain');
        const r3 = doc.get_model_by_name('radiation');

        if (!r1 || !r2 || !r3) return requestAnimationFrame(wait);

        if (document.getElementById('external-legend')) return;

        const legendDiv = document.createElement('div');
        legendDiv.id = 'external-legend';
        legendDiv.style.position = 'absolute';
        legendDiv.style.top = '80px';
        legendDiv.style.left = '690px';
        legendDiv.style.background = '#111';
        legendDiv.style.padding = '12px';
        legendDiv.style.border = '1px solid #444';
        legendDiv.style.borderRadius = '8px';
        legendDiv.style.color = '#fff';
        legendDiv.style.fontFamily = 'monospace';
        legendDiv.style.fontSize = '14px';
        legendDiv.style.zIndex = 1000;
        legendDiv.innerHTML = `
            <div data-key="temp" style="color: blue; cursor: pointer;">🔵 Temp</div>
            <div data-key="rain" style="color: red; cursor: pointer;">🔴 Rain</div>
            <div data-key="radiation" style="color: lime; cursor: pointer;">🟢 Radiation</div>
        `;
        document.body.appendChild(legendDiv);

        const lines = { temp: r1, rain: r2, radiation: r3 };

        legendDiv.querySelectorAll('[data-key]').forEach(item => {
            const key = item.dataset.key;
            item.addEventListener('mouseenter', () => {
                lines[key].glyph.line_width = 6;
                lines[key].change.emit();
            });
            item.addEventListener('mouseleave', () => {
                lines[key].glyph.line_width = 1;
                lines[key].change.emit();
            });
        });

        // Optional auto-hover
        // legendDiv.querySelector('[data-key="temp"]')?.dispatchEvent(new Event("mouseenter"));
    }

    requestAnimationFrame(wait);
""")
p.min_border_right=165
p.min_border_bottom=90;
p.styles = {'margin-top': '20px','margin-left': '20px','border-radius': '10px','box-shadow': '0 18px 20px rgba(165, 221, 253, 0.2)','padding': '5px','background-color': 'black','border': '1px solid red'}

doc = curdoc()
doc.add_root(p)
doc.js_on_event('document_ready', js)

output_file("external_legend_hover_auto.html")
show(p)
