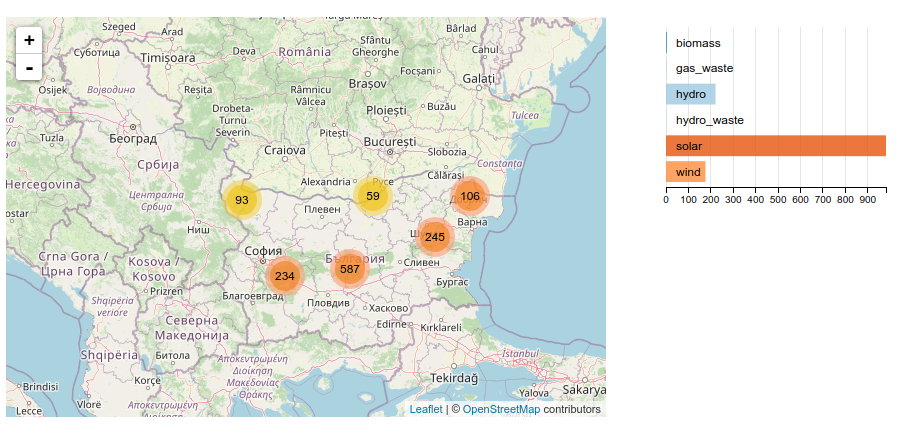
As you can see, there is a linked behaviour between the map boundaries and the chart.
I have started coding with bokeh from a jupyter notebook but haven’t found way to set interlinks:
display categories when map moves, display on the map selected categories.
@PBrockmann “linking a plot and a map” can mean just about anything, the question is too general/vague to offer much in the way of specific advice. I’d just say the answer is “yes”. But anything further depends on the details of what you actually want to accomplish. I’d suggest looking at the User Guide section on Javascript callbacks:
You do realize that support here is given on a volunteer basis and for free? I am not sure why you think resorting to sarcasm and insults will encourage me to spend those on you now. This is a support forum, not a code-writing/consulting shop. Just like with Stack Overflow or any other support forum, you will get the best results if you come with something you have tried in hand to focus the discussion.
Your question is practically the same as the one in this topic.
Hence, the answer is also the same - there’s no easy way to do it right now, so you will have to filter data manually based on the current ranges.
There are examples of all of those things individually in the docs. Just from your question, there is no way to know which of those things might be a sticking point for you. So the question is essentially “Please write a complicated example for me from scratch” and as I said this is not the place for that. But if you make some effort to put the pieces together as best you can, that’s a concrete starting point that doesn’t risk volunteers wasting their own time building parts that you could build yourself, or worse, building a big working example that solves the wrong problem. OSS maintainers are overtaxed and burned out. We want you to succeed but you need to meet us in the middle somewhere.
This what I had started as the attached image showed it.
Here is a small attempt to test a change on variables displayed on a scatter plot.
Accessing to various elements from the callback is not clear for me. For example the tooltips, how to change it from the JS code.