linked plot callback

Good afternoon.

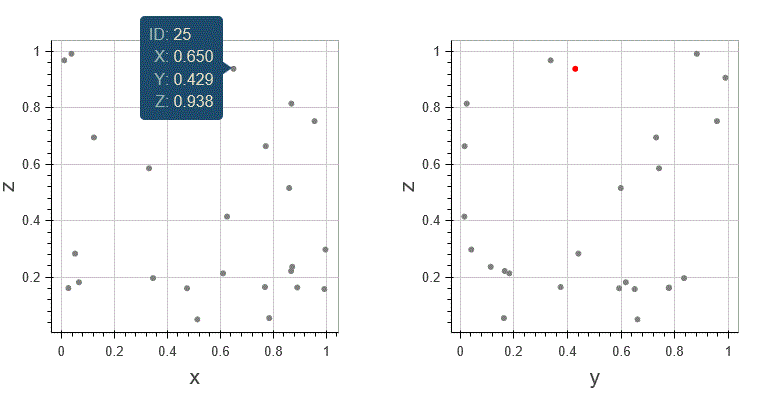
I have two linked plots and in this test when I hover over a point in the left plot the corresponding point in the right plot shows up red. In the code I also increase the size but that part does not seem to work. Do I need to use a different trigger for that?

Thanks!

Erwin

···

from pandas import DataFrame

from numpy.random import rand

from bokeh.models import ColumnDataSource, Circle, LinearAxis, Range1d, HoverTool, BoxSelectTool, CustomJS

from bokeh.plotting import figure, gridplot, output_file, output_notebook, show, save

N=25

df = DataFrame({‘x’: rand(N),‘y’: rand(N),‘z’: rand(N),

            'size1':5,'size2':5,'color1':"Gray",'color2':"Gray",'alpha1':1,'alpha2':1,
            'ID':[i+1 for i in range(N)],
           })

datasource = ColumnDataSource(df)

tooltip = [(“ID”, “@ID”),(“X”, “@x”),(“Y”, “@y”),(“Z”, “@z”)];

left plot

p1 = figure(plot_width=400, plot_height=400)

p1.xaxis.axis_label = ‘x’

p1.yaxis.axis_label = ‘z’

r1 = p1.circle(‘x’,‘z’,source=datasource,color=‘color1’,size=‘size1’,alpha=‘alpha1’)

Right plot

p2 = figure(plot_width=400, plot_height=400,tools=[HoverTool(tooltips=tooltip)])

p2.xaxis.axis_label = ‘y’

p2.yaxis.axis_label = ‘z’

r2 = p2.circle(‘y’,‘z’,source=datasource,color=‘color2’,size=‘size2’,alpha=‘alpha2’)

callback

cb1 = “”"

var indices = cb_data.index[‘1d’].indices;

var d = ds.get(‘data’);

var N = d[‘ID’].length;

var K = indices.length;

for(k=0;k<N;++k) {

d[‘color2’][k] = “Gray”;

d[‘size2’][k] = 5;

}

for(k=0;k<K;++k){

var i = indices[k];

var d = ds.get(‘data’);

d[‘color2’][i] = “Red”;

d[‘size2’][i] = 20;

}

p2.trigger(‘change’);

“”"

callback1 = CustomJS(args={‘p1’:p1,‘p2’:p2,‘ds’:datasource}, code=cb1)

p1.add_tools(HoverTool(tooltips=tooltip, callback=callback1))

output_file(“hovertest.html”)

p = gridplot([[p1,p2]])

show(p)
Erwin,

You need to trigger the change on the data source (ds), since that is what is changing, not on the plot.

Bryan

···

On Mar 18, 2016, at 12:47 PM, Erwin Kalvelagen <[email protected]> wrote:

from pandas import DataFrame
from numpy.random import rand
from bokeh.models import ColumnDataSource, Circle, LinearAxis, Range1d, HoverTool, BoxSelectTool, CustomJS
from bokeh.plotting import figure, gridplot, output_file, output_notebook, show, save

N=25

df = DataFrame({'x': rand(N),'y': rand(N),'z': rand(N),
                'size1':5,'size2':5,'color1':"Gray",'color2':"Gray",'alpha1':1,'alpha2':1,
                'ID':[i+1 for i in range(N)],
               })

datasource = ColumnDataSource(df)

tooltip = [("ID", "@ID"),("X", "@x"),("Y", "@y"),("Z", "@z")];

#
# left plot
#
p1 = figure(plot_width=400, plot_height=400)
p1.xaxis.axis_label = 'x'
p1.yaxis.axis_label = 'z'
r1 = p1.circle('x','z',source=datasource,color='color1',size='size1',alpha='alpha1')

#
# Right plot
#
p2 = figure(plot_width=400, plot_height=400,tools=[HoverTool(tooltips=tooltip)])
p2.xaxis.axis_label = 'y'
p2.yaxis.axis_label = 'z'
r2 = p2.circle('y','z',source=datasource,color='color2',size='size2',alpha='alpha2')

#
# callback
#
cb1 = """
var indices = cb_data.index['1d'].indices;
var d = ds.get('data');
var N = d['ID'].length;
var K = indices.length;
for(k=0;k<N;++k) {
  d['color2'][k] = "Gray";
  d['size2'][k] = 5;
}
for(k=0;k<K;++k){
  var i = indices[k];
  var d = ds.get('data');
  d['color2'][i] = "Red";
  d['size2'][i] = 20;

}
p2.trigger('change');
"""
callback1 = CustomJS(args={'p1':p1,'p2':p2,'ds':datasource}, code=cb1)
p1.add_tools(HoverTool(tooltips=tooltip, callback=callback1))

output_file("hovertest.html")
p = gridplot([[p1,p2]])
show(p)

Works like charm! Thanks very much,

···

On Friday, March 18, 2016 at 4:28:41 PM UTC-4, Bryan Van de ven wrote:

Erwin,

You need to trigger the change on the data source (ds), since that is what is changing, not on the plot.

Bryan

On Mar 18, 2016, at 12:47 PM, Erwin Kalvelagen [email protected] wrote:

from pandas import DataFrame

from numpy.random import rand

from bokeh.models import ColumnDataSource, Circle, LinearAxis, Range1d, HoverTool, BoxSelectTool, CustomJS

from bokeh.plotting import figure, gridplot, output_file, output_notebook, show, save

N=25

df = DataFrame({‘x’: rand(N),‘y’: rand(N),‘z’: rand(N),

            'size1':5,'size2':5,'color1':"Gray",'color2':"Gray",'alpha1':1,'alpha2':1,
            'ID':[i+1 for i in range(N)],
           })

datasource = ColumnDataSource(df)

tooltip = [(“ID”, “@ID”),(“X”, “@x”),(“Y”, “@y”),(“Z”, “@z”)];

left plot

p1 = figure(plot_width=400, plot_height=400)

p1.xaxis.axis_label = ‘x’

p1.yaxis.axis_label = ‘z’

r1 = p1.circle(‘x’,‘z’,source=datasource,color=‘color1’,size=‘size1’,alpha=‘alpha1’)

Right plot

p2 = figure(plot_width=400, plot_height=400,tools=[HoverTool(tooltips=tooltip)])

p2.xaxis.axis_label = ‘y’

p2.yaxis.axis_label = ‘z’

r2 = p2.circle(‘y’,‘z’,source=datasource,color=‘color2’,size=‘size2’,alpha=‘alpha2’)

callback

cb1 = “”"

var indices = cb_data.index[‘1d’].indices;

var d = ds.get(‘data’);

var N = d[‘ID’].length;

var K = indices.length;

for(k=0;k<N;++k) {

d[‘color2’][k] = “Gray”;

d[‘size2’][k] = 5;

}

for(k=0;k<K;++k){

var i = indices[k];

var d = ds.get(‘data’);

d[‘color2’][i] = “Red”;

d[‘size2’][i] = 20;

}

p2.trigger(‘change’);

“”"

callback1 = CustomJS(args={‘p1’:p1,‘p2’:p2,‘ds’:datasource}, code=cb1)

p1.add_tools(HoverTool(tooltips=tooltip, callback=callback1))

output_file(“hovertest.html”)

p = gridplot([[p1,p2]])

show(p)