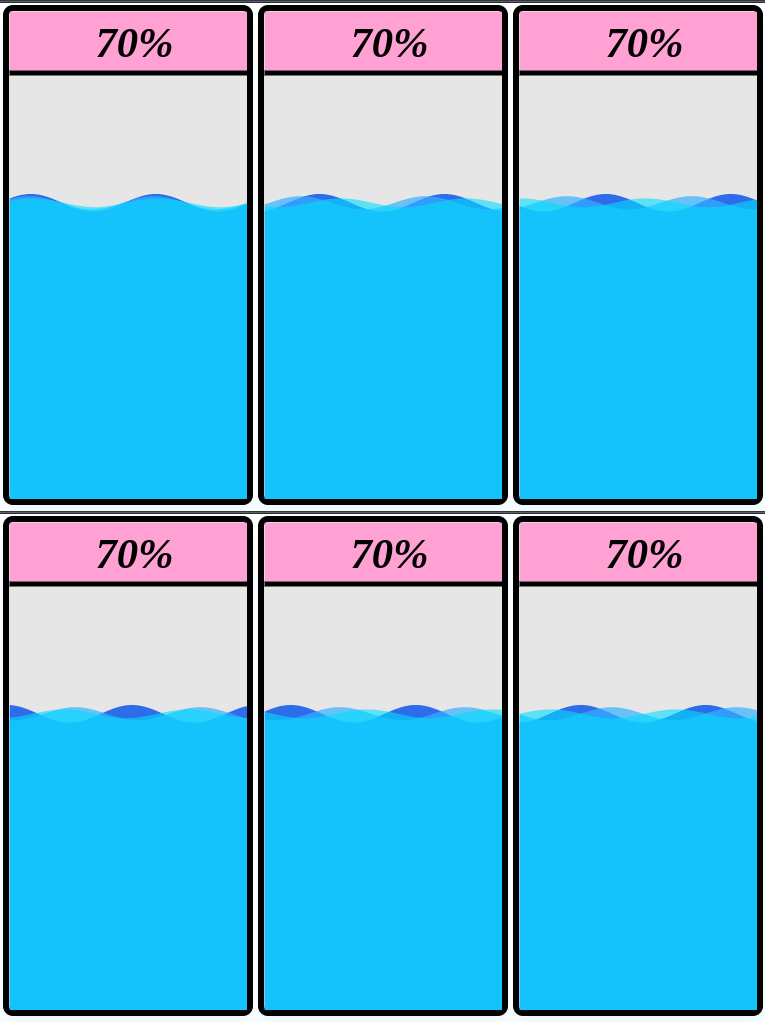
An animated Liquid Fill graphic.

Server
import numpy as np

from bokeh.io import curdoc
from bokeh.plotting import figure
from bokeh.models import ColumnDataSource
from bokeh.models import Span
# ─── PARAMETERS ────────────────────────────────────────────────────────────────
N_POINTS           = 1000        # super-smooth curves
WIDTH              = 10.0
UPDATE_INTERVAL_MS = 20          # ~50 fps
FILL_RATIO         = 0.7       # 70% “liquid” level

# each layer: small amplitude, frequency, color, alpha
LAYERS = [
    {"ampl": 0.02, "freq": 0.5, "color": "#004eea", "alpha": 0.8},
    {"ampl": 0.015, "freq": 0.6, "color": "#32b0ff", "alpha": 0.7},
    {"ampl": 0.01, "freq": 0.4, "color": "#00ddff", "alpha": 0.6},
]

# prepare x values
x = np.linspace(0, WIDTH, N_POINTS)

# ─── FIGURE SETUP ───────────────────────────────────────────────────────────────
p = figure(
    x_range=(0, WIDTH),
    y_range=(0, 1),
    width=250, height=500,          # tall, narrow figure
    tools="", toolbar_location=None
)

# hide axes, grids, background
for ax in (p.xaxis, p.yaxis):
    ax.visible = False
p.xgrid.grid_line_color = None
p.ygrid.grid_line_color = None
p.background_fill_color = None
p.border_fill_color     = "#ffa1d2"
p.min_border_left = p.min_border_right = p.min_border_top = p.min_border_bottom = 0
p.outline_line_color = None
p.axis.visible = False
p.grid.visible = False
p.outline_line_color = None
p.toolbar.logo = None
p.toolbar_location = None
xz = np.linspace(0, WIDTH, N_POINTS+200)


hline = Span(
    location=1,       # y-coordinate
    dimension='width',         # span across the full x-range
    line_color='black',
    line_width=10               # thickness in pixels
)
p.add_layout(hline)
# ─── TITLE WITH PERCENT ─────────────────────────────────────────────────────────
percent = int(FILL_RATIO * 100)
p.title.text = f"{percent}%"
p.title.align = "center"
p.title.text_font = "Georgia"
p.title.text_font_size = "32pt"
p.title.text_font_style = "bold italic"
p.title.text_color = "black"


p.styles = {'margin-top': '20px','margin-left': '20px','border-radius': '10px',
'box-shadow': '0 18px 20px rgba(165, 221, 253, 0.2)','padding': '0px',
'background-color': '#e6e6e6','border': '6px solid #000000'}
# ─── WAVE LAYERS & DATA SOURCES ─────────────────────────────────────────────────
sources = []
phases = np.zeros(len(LAYERS))

for layer in LAYERS:
    y1 = FILL_RATIO + layer["ampl"] * np.sin(2*np.pi*(x/WIDTH*2))
    src = ColumnDataSource(dict(x=x, y1=y1, y2=np.zeros_like(x)))
    p.varea(
        x="x", y1="y1", y2="y2", source=src,
        fill_color=layer["color"], fill_alpha=layer["alpha"]
    )
    sources.append(src)

def update():
    dt = UPDATE_INTERVAL_MS / 1000.0
    for i, (layer, src) in enumerate(zip(LAYERS, sources)):
        phases[i] += layer["freq"] * dt
        y1 = FILL_RATIO + layer["ampl"] * np.sin(
            2*np.pi*(x/WIDTH*2 + phases[i])
        )
        src.data = dict(x=x, y1=y1, y2=np.zeros_like(x))

# ─── LAUNCH ────────────────────────────────────────────────────────────────────
curdoc().add_root(p)
curdoc().add_periodic_callback(update, UPDATE_INTERVAL_MS)
Static
import numpy as np
import json

from bokeh.plotting import figure, output_file, show
from bokeh.models import ColumnDataSource, CustomJS, Span
from bokeh.events import DocumentReady
from bokeh.io import curdoc

# ─── PARAMETERS ────────────────────────────────────────────────────────────────
N_POINTS           = 1000        # super-smooth curves
WIDTH              = 10.0
UPDATE_INTERVAL_MS = 20          # ~50 fps
FILL_RATIO         = 0.7         # 70% “liquid” level

LAYERS = [
    {"ampl": 0.02, "freq": 0.5, "color": "#004eea", "alpha": 0.8},
    {"ampl": 0.015, "freq": 0.6, "color": "#32b0ff", "alpha": 0.7},
    {"ampl": 0.01, "freq": 0.4, "color": "#00ddff", "alpha": 0.6},
]

# ─── DATA SOURCES ──────────────────────────────────────────────────────────────
x = np.linspace(0, WIDTH, N_POINTS)
sources = []
for layer in LAYERS:
    y1 = FILL_RATIO + layer["ampl"] * np.sin(2 * np.pi * (x / WIDTH * 2))
    y2 = np.zeros_like(x)
    src = ColumnDataSource(data=dict(x=x, y1=y1, y2=y2))
    sources.append(src)

# ─── PLOT SETUP ─────────────────────────────────────────────────────────────────
p = figure(
    x_range=(0, WIDTH), y_range=(0,1),
    width=250, height=500,
    tools="", toolbar_location=None,
)

# hide axes and grids
p.xaxis.visible = False
p.yaxis.visible = False
p.xgrid.grid_line_color = None
p.ygrid.grid_line_color = None

# border fill (pink) and then override with CSS below
p.background_fill_color = None
p.border_fill_color     = "#ffa1d2"

# remove extra outlines, toolbar, margins
p.outline_line_color = None
p.toolbar.logo       = None
p.toolbar_location   = None
p.min_border_left = p.min_border_right = p.min_border_top = p.min_border_bottom = 0

# thick black horizontal line at y=1
hline = Span(location=1, dimension='width',
             line_color='black', line_width=10)
p.add_layout(hline)

# title at top
percent = int(FILL_RATIO * 100)
p.title.text = f"{percent}%"
p.title.align = "center"
p.title.text_font = "Georgia"
p.title.text_font_size = "32pt"
p.title.text_font_style = "bold italic"
p.title.text_color = "black"

# CSS styling on the plot container
p.styles = {
    'margin-top':    '20px',
    'margin-left':   '20px',
    'border-radius': '10px',
    'box-shadow':    '0 18px 20px rgba(165, 221, 253, 0.2)',
    'padding':       '0px',
    'background-color': '#e6e6e6',
    'border':        '6px solid #000000'
}

# draw the wave areas
for src, layer in zip(sources, LAYERS):
    p.varea(
        x="x", y1="y1", y2="y2", source=src,
        fill_color=layer["color"], fill_alpha=layer["alpha"],
    )

# ─── JS ANIMATION CALLBACK ───────────────────────────────────────────────────────
# pass our ColumnDataSources into JS
callback_args = { f"src{i}": src for i, src in enumerate(sources) }
js_layers = json.dumps(LAYERS)

js_code = f"""
(function() {{
    const layers = {js_layers};
    const sources = [src0, src1, src2];
    const F = {FILL_RATIO};
    const W = {WIDTH};
    const DT = {UPDATE_INTERVAL_MS}/1000;
    let phases = layers.map(() => 0);

    // start animating right after render
    setTimeout(() => {{
        setInterval(() => {{
            for (let i = 0; i < layers.length; i++) {{
                phases[i] += layers[i].freq * DT;
                const data = sources[i].data;
                const xs = data['x'], ys = data['y1'];
                for (let j = 0; j < xs.length; j++) {{
                    ys[j] = F + layers[i].ampl *
                            Math.sin(2*Math.PI*((xs[j]/W)*2 + phases[i]));
                }}
                data['y2'] = new Array(xs.length).fill(0);
                sources[i].change.emit();
            }}
        }}, {UPDATE_INTERVAL_MS});
    }}, 0);
}})();
"""

callback = CustomJS(args=callback_args, code=js_code)
p.js_on_event(DocumentReady, callback)
# Add animation trigger
doc = curdoc()
doc.add_root(p)
doc.js_on_event('document_ready', callback)
# ─── OUTPUT ────────────────────────────────────────────────────────────────────
output_file("_static.html", title="Liquid Fill 70%")
show(p)