Context(shortly!): Scientific experiment in atomic physics (cf. review or publi )
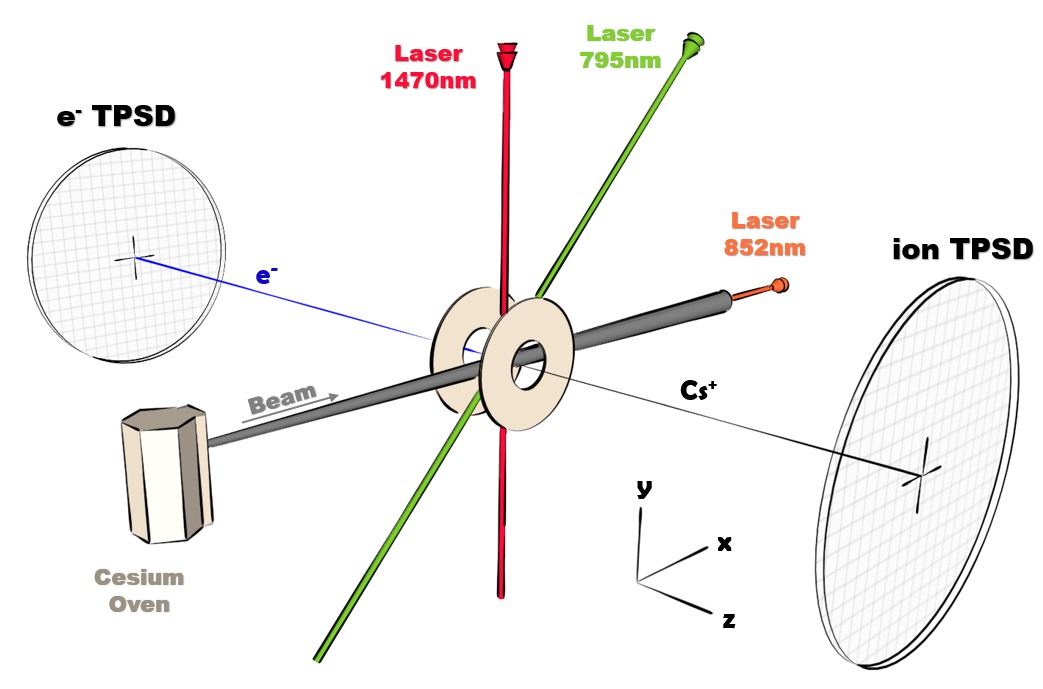
The idea is to create a new ion source. To try that, we ionizate Cesium atoms by lasers in the center of a vaccum chamber between two holed electrodes. One negative attracts the ion Cs+ and the other one positive attracts the electron. So, both particles are projected on two Time and Position Sensitive Detectors (TPSD). At the end, we get a simple csv file with coordinate (x,y) and ToF (Time Of Flight) for each “coupled particule”. We can simulate this experiment and try to guess the initial position of Cesium Atoms.
The important point is to understand that each “coupled particule” are linked (or correlated): you can deduce the final position of each ion Cs+ (moving very slowly) thanks to its “brother” e- (moving fast). So, if you can know position of each ion, you can control it and bring it where you want : it means you create an ion source…
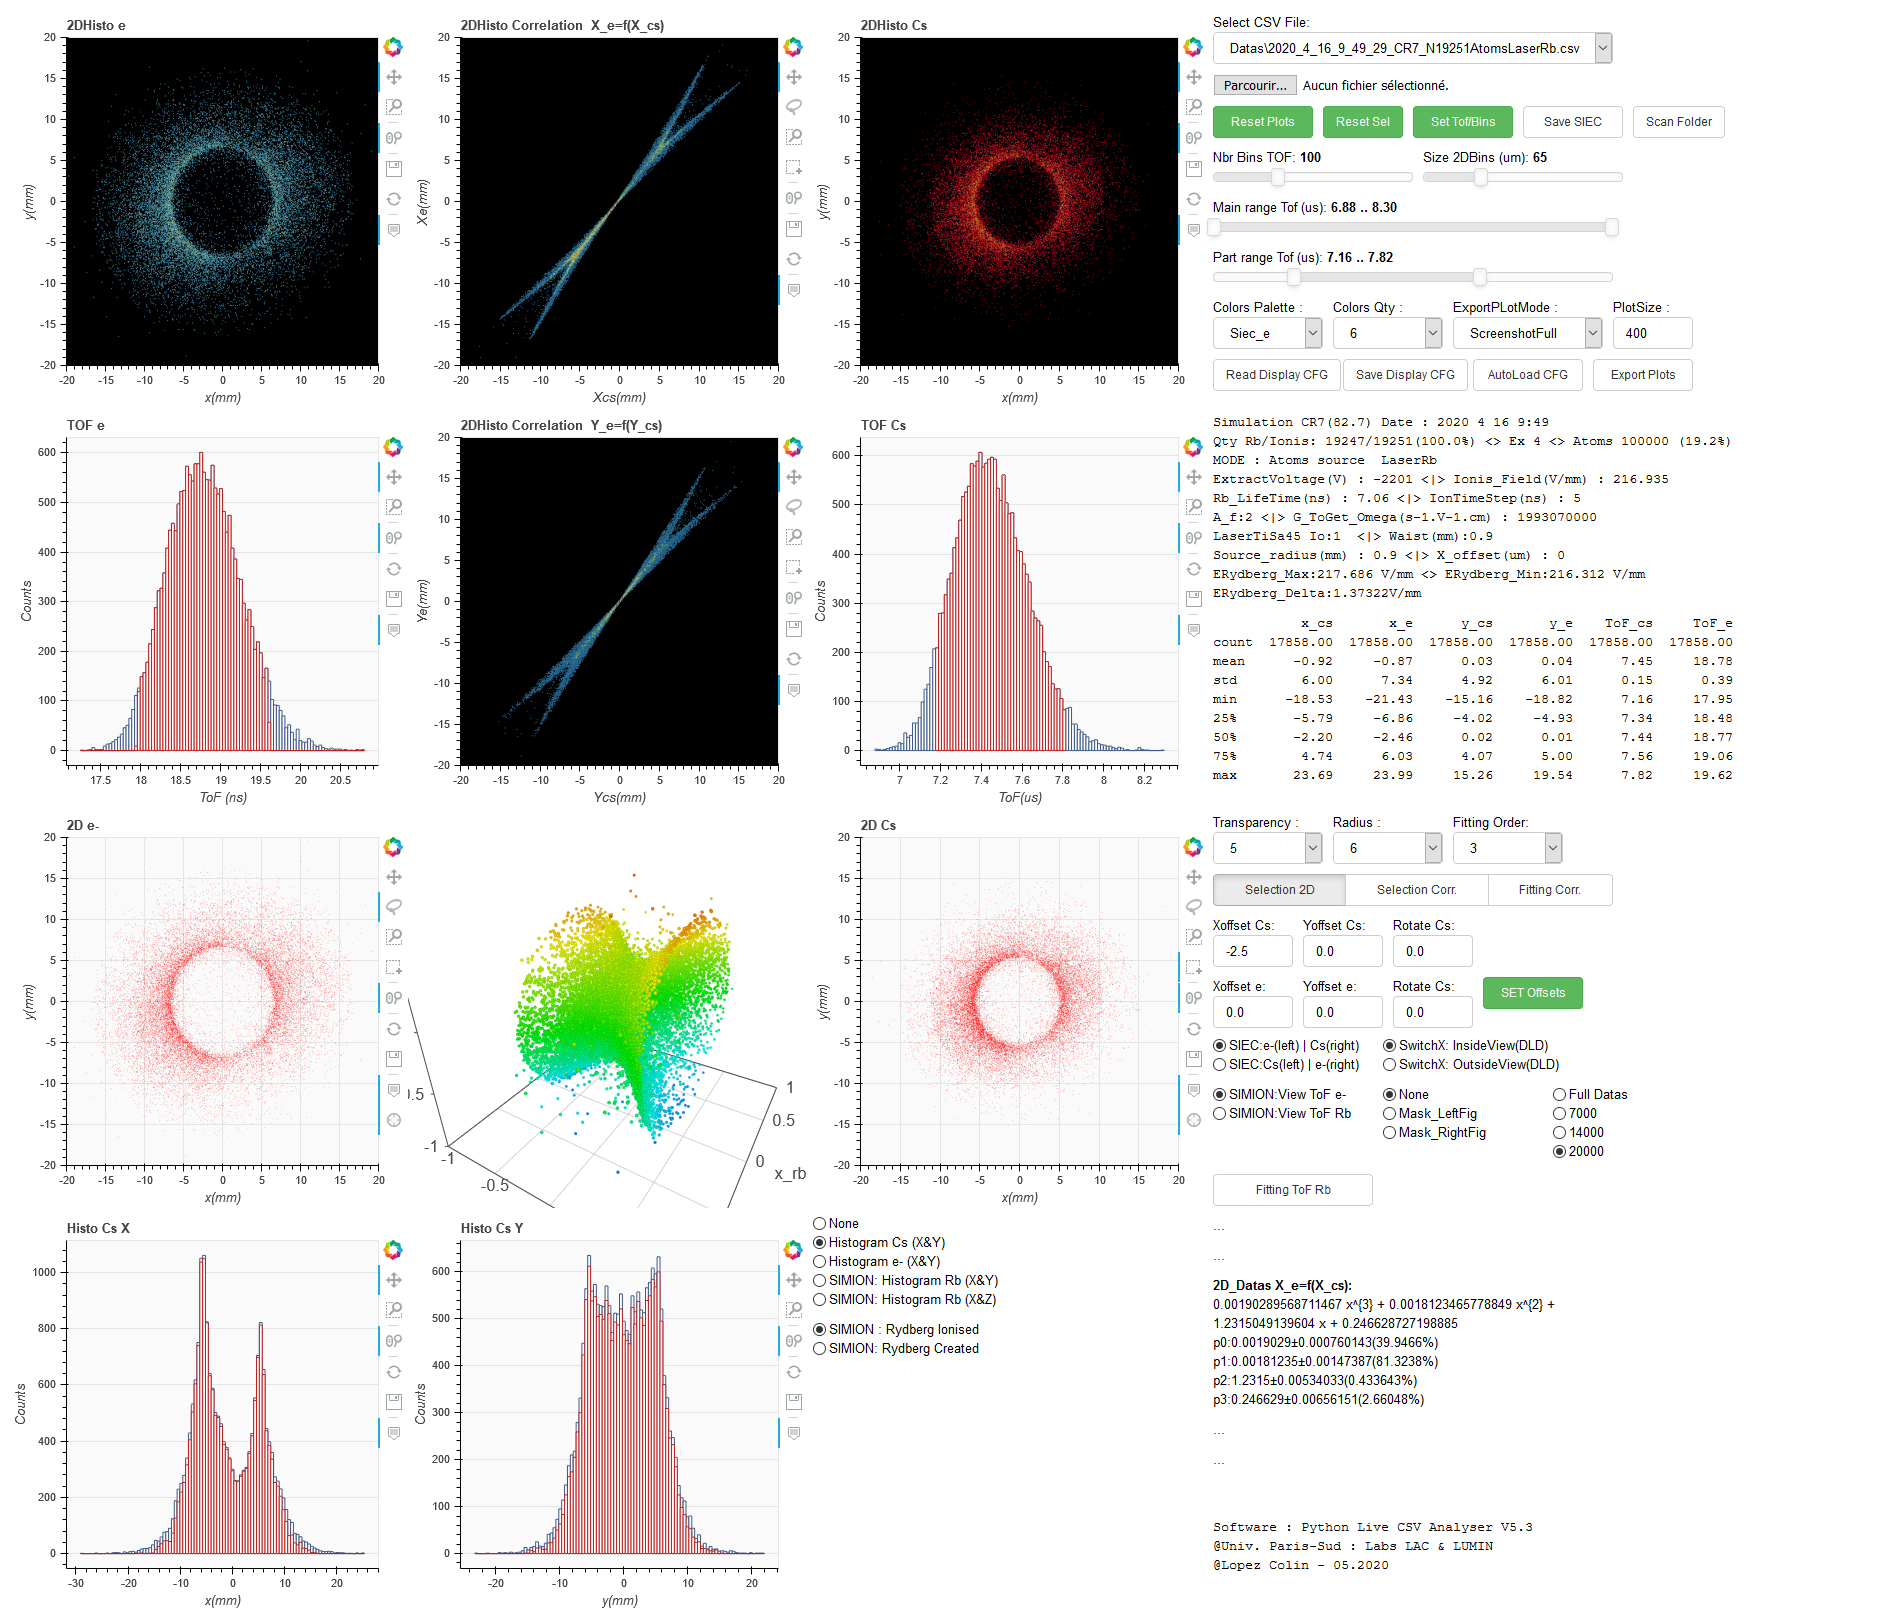
This application can extract csv files and show:
- 2D position of Cs+/e- ( [x_cs,y_cs] and [x_e,y_e])
- Correlated position of Cs+/e- ( [x_cs,x_e] and [y_cs,y_e])
- Tof and 3D position of Cesium Atoms (simulation file only)
- ToF e-/Cs+
- Some x,y histograms
Now we can do:
- 2D selection of electrons to see what happen on Cs+ side
- 2D selection of ions Cs+ to see what happen on e- side
- Cs+ Tof Selection to see what happen on 2D/corr. position of Cs+/e-
- Fitting the X or Y correlation figure
- See in 3D what happen on Cesium Atoms (simulation file only)
- Automatically extract pictures for documents
- Web application usable for my collegues at home

Thanks to bokeh, it was really easy to understand what happen in the center of the experiment (the 3D view) and configure the simulation software (SIMION) to recreate the experiment (basically if 2D fig. of e-/Cs+ is similar, it means we got it!). For exemple, we understand the “face” of 2D plots: it was due to the “face” of electric field in the center of the experiment.
This application in action there (3min): youtube
One sample simulation : CR7 (extraction no widget works and probably slow to download cause slow cloud server)
Thanks : special thanks to bryan and p-himik very helpful in community support !
Wish for bokeh  : get “rasterization level” for hexbin figure to avoid alliasing effect (topic here)
Colin
 That look really terrific, thank you for sharing! We will tweet this out this week if that’s ok!