Hello,
Here is Nephele:
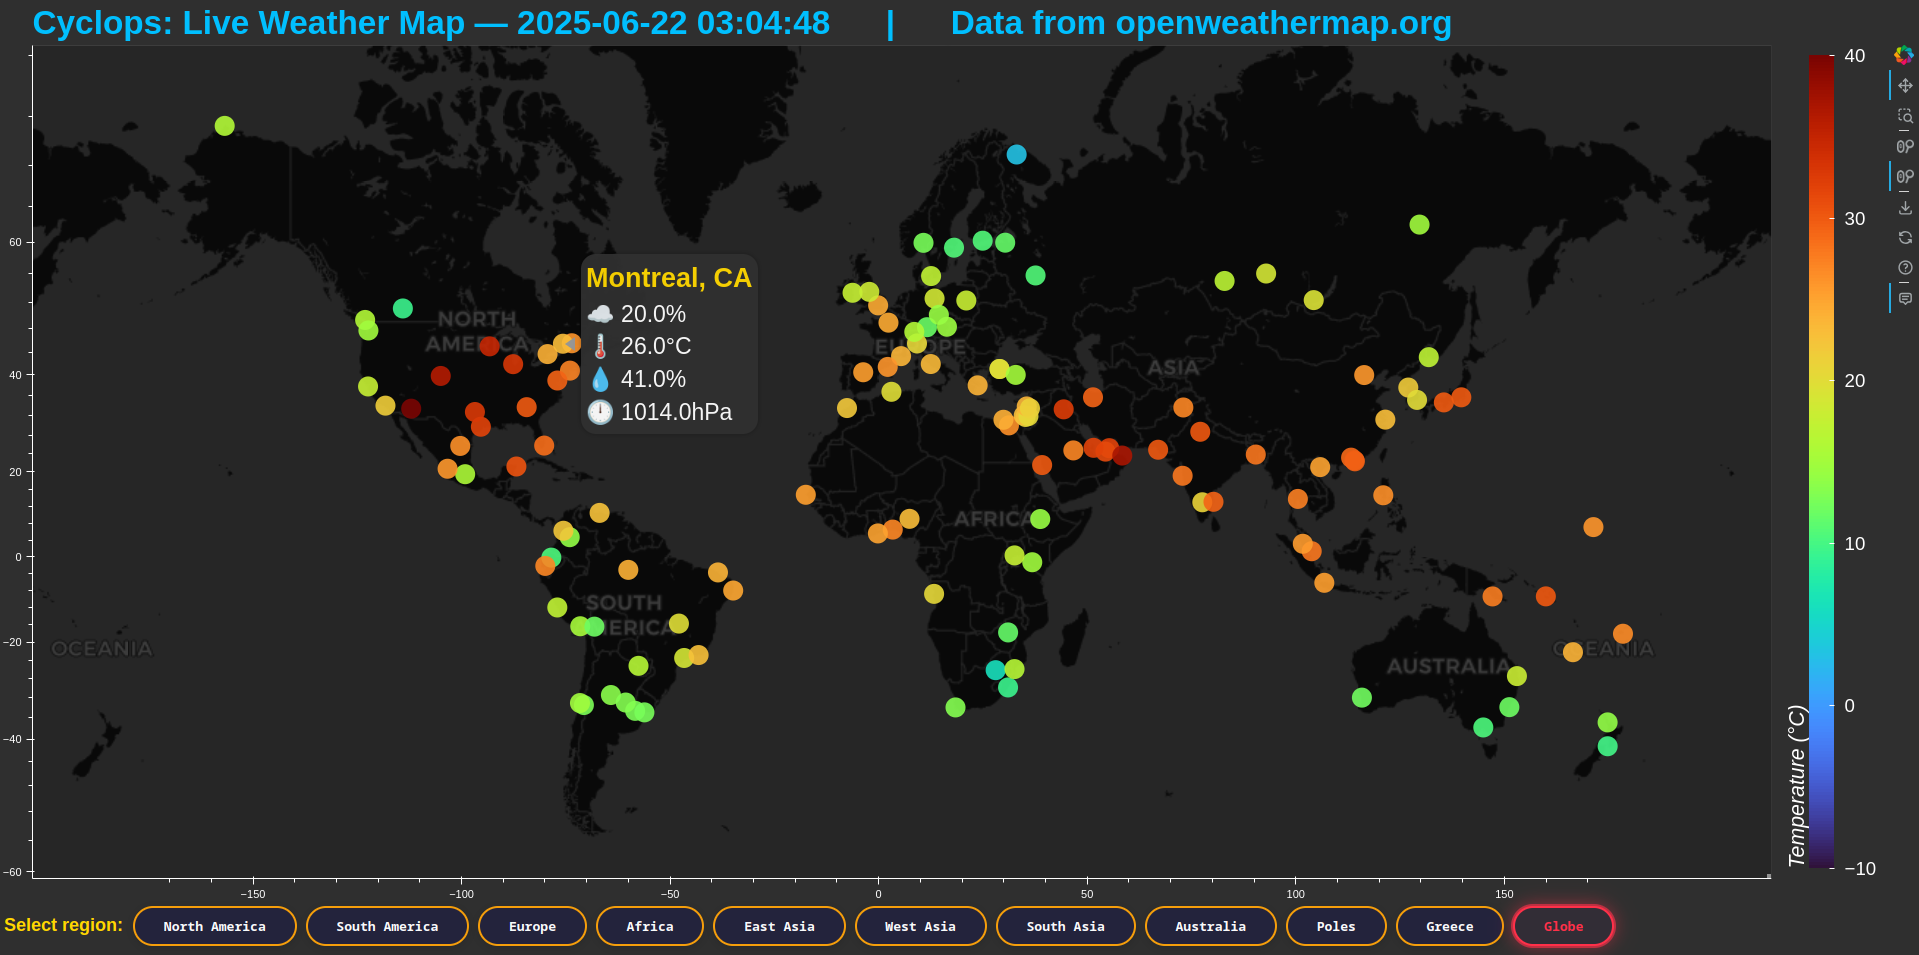
An interactive dark-themed map that plots real-time cloudiness, temperature, humidity and pressure for several cities of the world. Built with Bokeh Server, it pulls data every minute from OpenWeatherMap (using my API key) and renders styled circle markers over a CartoDB “Dark Matter” basemap.
# WM_app.py
import os
import numpy as np
import requests
from datetime import datetime

from bokeh.io import curdoc
from bokeh.models import (
    ColumnDataSource,
    LinearColorMapper,
    ColorBar,
    BasicTicker,
    WheelZoomTool,
    HoverTool,
)
from bokeh.plotting import figure
from bokeh.models import WMTSTileSource


# ─── Helper: convert lat/lon to Web Mercator ───────────────────────────────────
def latlon_to_mercator(lat, lon):
    """Convert (lat, lon) in degrees to Web Mercator (x, y)."""
    k = 6378137.0
    x = lon * (k * np.pi / 180.0)
    y = np.log(np.tan((90 + lat) * np.pi / 360.0)) * k
    return x, y


# ─── Configuration ────────────────────────────────────────────────────────────
API_KEY = os.getenv("OPENWEATHERMAP_API_KEY", "<YOUR_OPENWEATHERMAP_API_KEY>")
UPDATE_INTERVAL_MS = 60 * 1000  # 1 minute

# ─── Expanded List of >50 Cities ───────────────────────────────────────────────
cities = [ {"name": "London, UK", "lat": 51.5074, "lon": -0.1278}, {"name": "Paris, FR", "lat": 48.8566, "lon": 2.3522}, {"name": "Berlin, DE", "lat": 52.5200, "lon": 13.4050}, {"name": "Madrid, ES", "lat": 40.4168, "lon": -3.7038}, {"name": "Rome, IT", "lat": 41.9028, "lon": 12.4964}, {"name": "Lisbon, PT", "lat": 38.7223, "lon": -9.1393}, {"name": "Dublin, IE", "lat": 53.3498, "lon": -6.2603}, {"name": "Brussels, BE", "lat": 50.8503, "lon": 4.3517}, {"name": "Amsterdam, NL", "lat": 52.3676, "lon": 4.9041}, {"name": "Vienna, AT", "lat": 48.2082, "lon": 16.3738}, {"name": "Barcelona, ES", "lat": 41.3851, "lon": 2.1734}, {"name": "Munich, DE", "lat": 48.1351, "lon": 11.5820}, {"name": "Milan, IT", "lat": 45.4642, "lon": 9.1900}, {"name": "Hamburg, DE", "lat": 53.5511, "lon": 9.9937}, {"name": "Frankfurt, DE", "lat": 50.1109, "lon": 8.6821}, {"name": "Zurich, CH", "lat": 47.3769, "lon": 8.5417}, {"name": "Stockholm, SE", "lat": 59.3293, "lon": 18.0686}, {"name": "Copenhagen, DK", "lat": 55.6761, "lon": 12.5683}, {"name": "Oslo, NO", "lat": 59.9139, "lon": 10.7522}, {"name": "Helsinki, FI", "lat": 60.1699, "lon": 24.9384}, {"name": "Reykjavik, IS", "lat": 64.1466, "lon": -21.9426}, {"name": "Warsaw, PL", "lat": 52.2297, "lon": 21.0122}, {"name": "Prague, CZ", "lat": 50.0755, "lon": 14.4378}, {"name": "Budapest, HU", "lat": 47.4979, "lon": 19.0402}, {"name": "Bratislava, SK", "lat": 48.1486, "lon": 17.1077}, {"name": "Ljubljana, SI", "lat": 46.0569, "lon": 14.5058}, {"name": "Zagreb, HR", "lat": 45.8150, "lon": 15.9819}, {"name": "Sarajevo, BA", "lat": 43.8563, "lon": 18.4131}, {"name": "Belgrade, RS", "lat": 44.7866, "lon": 20.4489}, {"name": "Bucharest, RO", "lat": 44.4268, "lon": 26.1025}, {"name": "Sofia, BG", "lat": 42.6977, "lon": 23.3219}, {"name": "Athens, GR", "lat": 37.9838, "lon": 23.7275}, {"name": "Valencia, ES", "lat": 39.4699, "lon": -0.3763}, {"name": "Seville, ES", "lat": 37.3891, "lon": -5.9845}, {"name": "Bilbao, ES", "lat": 43.2630, "lon": -2.9350}, {"name": "Nice, FR", "lat": 43.7102, "lon": 7.2620}, {"name": "Marseille, FR", "lat": 43.2965, "lon": 5.3698}, {"name": "Lyon, FR", "lat": 45.7640, "lon": 4.8357}, {"name": "Manchester, UK", "lat": 53.4808, "lon": -2.2426}, {"name": "Edinburgh, UK", "lat": 55.9533, "lon": -3.1883}, {"name": "Birmingham, UK", "lat": 52.4862, "lon": -1.8904}, {"name": "Valletta, MT", "lat": 35.8989, "lon": 14.5146}, {"name": "Luxembourg, LU", "lat": 49.6116, "lon": 6.1319}, {"name": "Riga, LV", "lat": 56.9496, "lon": 24.1052}, {"name": "Vilnius, LT", "lat": 54.6872, "lon": 25.2797}, {"name": "Tallinn, EE", "lat": 59.43696, "lon": 24.7536}, {"name": "Tokyo, JP", "lat": 35.6895, "lon": 139.6917}, {"name": "Delhi, IN", "lat": 28.7041, "lon": 77.1025}, {"name": "Shanghai, CN", "lat": 31.2304, "lon": 121.4737}, {"name": "São Paulo, BR", "lat": -23.5505, "lon": -46.6333}, {"name": "Mexico City, MX", "lat": 19.4326, "lon": -99.1332}, {"name": "Cairo, EG", "lat": 30.0444, "lon": 31.2357}, {"name": "Mumbai, IN", "lat": 19.0760, "lon": 72.8777}, {"name": "Beijing, CN", "lat": 39.9042, "lon": 116.4074}, {"name": "Dhaka, BD", "lat": 23.8103, "lon": 90.4125}, {"name": "Osaka, JP", "lat": 34.6937, "lon": 135.5023}, {"name": "New York, US", "lat": 40.7128, "lon": -74.0060}, {"name": "Karachi, PK", "lat": 24.8607, "lon": 67.0011}, {"name": "Buenos Aires, AR", "lat": -34.6037, "lon": -58.3816}, {"name": "Chongqing, CN", "lat": 29.4316, "lon": 106.9123}, {"name": "Istanbul, TR", "lat": 41.0082, "lon": 28.9784}, {"name": "Kolkata, IN", "lat": 22.5726, "lon": 88.3639}, {"name": "Manila, PH", "lat": 14.5995, "lon": 120.9842}, {"name": "Lagos, NG", "lat": 6.5244, "lon": 3.3792}, {"name": "Rio de Janeiro, BR", "lat": -22.9068, "lon": -43.1729}, {"name": "Tianjin, CN", "lat": 39.3434, "lon": 117.3616}, {"name": "Kinshasa, CD", "lat": -4.4419, "lon": 15.2663}, {"name": "Guangzhou, CN", "lat": 23.1291, "lon": 113.2644}, {"name": "Los Angeles, US", "lat": 34.0522, "lon": -118.2437}, {"name": "Moscow, RU", "lat": 55.7558, "lon": 37.6173}, {"name": "Shenzhen, CN", "lat": 22.5431, "lon": 114.0579}, {"name": "Lahore, PK", "lat": 31.5204, "lon": 74.3587}, {"name": "Bangalore, IN", "lat": 12.9716, "lon": 77.5946}, {"name": "Paris, FR", "lat": 48.8566, "lon": 2.3522}, {"name": "Bogotá, CO", "lat": 4.7110, "lon": -74.0721}, {"name": "Chennai, IN", "lat": 13.0827, "lon": 80.2707}, {"name": "Jakarta, ID", "lat": -6.2088, "lon": 106.8456}, {"name": "Lima, PE", "lat": -12.0464, "lon": -77.0428}, {"name": "Bangkok, TH", "lat": 13.7563, "lon": 100.5018}, {"name": "Seoul, KR", "lat": 37.5665, "lon": 126.9780}, {"name": "Nagoya, JP", "lat": 35.1815, "lon": 136.9066}, {"name": "Hyderabad, IN", "lat": 17.3850, "lon": 78.4867}, {"name": "London, UK", "lat": 51.5074, "lon": -0.1278}, {"name": "Tehran, IR", "lat": 35.6892, "lon": 51.3890}, {"name": "Chicago, US", "lat": 41.8781, "lon": -87.6298}, {"name": "Chengdu, CN", "lat": 30.5728, "lon": 104.0668}, {"name": "Nanjing, CN", "lat": 32.0603, "lon": 118.7969}, {"name": "Wuhan, CN", "lat": 30.5928, "lon": 114.3055}, {"name": "Ho Chi Minh City, VN", "lat": 10.8231, "lon": 106.6297}, {"name": "Luanda, AO", "lat": -8.8390, "lon": 13.2894}, {"name": "Ahmedabad, IN", "lat": 23.0225, "lon": 72.5714}, {"name": "Kuala Lumpur, MY", "lat": 3.1390, "lon": 101.6869}, {"name": "Xi’an, CN", "lat": 34.3416, "lon": 108.9398}, {"name": "Hong Kong, HK", "lat": 22.3193, "lon": 114.1694}, {"name": "Hangzhou, CN", "lat": 30.2741, "lon": 120.1551}, {"name": "Foshan, CN", "lat": 23.0215, "lon": 113.1214}, {"name": "Shenyang, CN", "lat": 41.8057, "lon": 123.4315}, ]


# Precompute mercator coordinates
merc_x, merc_y = zip(*(latlon_to_mercator(c["lat"], c["lon"]) for c in cities))

# ColumnDataSource for our plot
source = ColumnDataSource(
    data=dict(
        x=list(merc_x),
        y=list(merc_y),
        name=[c["name"] for c in cities],
        cloud=[0] * len(cities),  # placeholder, will be updated
        temp=[0] * len(cities),  # temperature °C
        humidity=[0] * len(cities),  # humidity %
        pressure=[0] * len(cities),  # pressure hPa
    )
)

# ─── Build dark-background map figure ──────────────────────────────────────────
# Generate dynamic title with current datetime
title_str = f"Live Weather Map — {datetime.now().strftime('%Y-%m-%d %H:%M:%S')}"
p = figure(
    x_axis_type="mercator",
    y_axis_type="mercator",
    sizing_mode="stretch_both",
    title=title_str,
    background_fill_color="#2F2F2F",
    border_fill_color="#2F2F2F",
    outline_line_color="#444444",
)
dark_url = "https://basemaps.cartocdn.com/dark_all/{Z}/{X}/{Y}.png"
tile_provider = WMTSTileSource(url=dark_url)
p.add_tile(tile_provider)

# Enable wheel zoom by default
wheel_zoom = WheelZoomTool()
p.add_tools(wheel_zoom)
p.toolbar.active_scroll = wheel_zoom

# style title & axes for dark theme
p.title.text_color = "deepskyblue"
p.title.text_font = "Helvetica"
p.title.text_font_style = "bold"
p.title.text_font_size = "25pt"


for axis in (p.xaxis, p.yaxis):
    axis.axis_line_color = "white"
    axis.major_tick_line_color = "white"
    axis.major_label_text_color = "white"
    axis.minor_tick_line_color = "white"
# remove grid lines for a cleaner map
p.xgrid.grid_line_color = None
p.ygrid.grid_line_color = None
# Color mapper and circles
color_mapper = LinearColorMapper(palette="Turbo256", low=-10, high=40)
circles = p.scatter(
    "x",
    "y",
    source=source,
    size=20,
    fill_color={"field": "temp", "transform": color_mapper},
    fill_alpha=0.9,
    line_color=None,
)


# ─── Enhanced HoverTool with HTML styling ─────────────────────────────────────
hover = HoverTool(
    renderers=[circles],
    point_policy="follow_mouse",
    tooltips="""
    <div style='background-color: rgba(0,0,0,0.8); padding:10px; border-radius:5px; width:180px;'>
      <div style='font-size:27px; color:#FFD700; font-weight:bold;'>@name</div>
      <div style='font-size:23px; color:#FFFFFF;'>☁️ @cloud{0.0}%</div>
      <div style='font-size:23px; color:#FFFFFF;'>🌡️ @temp{0.0}°C</div>
      <div style='font-size:23px; color:#FFFFFF;'>💧 @humidity{0.0}%</div>
      <div style='font-size:23px; color:#FFFFFF;'>🕛 @pressure{0.0}hPa</div>
    </div>
    """,
)
p.add_tools(hover)

# color bar for reference
color_bar = ColorBar(
    title_text_font_size="16pt",
    major_label_text_font_size="14pt",
    background_fill_color="#2F2F2F",
    color_mapper=color_mapper,
    title_text_color="white",
    major_label_text_color="white",
    label_standoff=10,
    ticker=BasicTicker(desired_num_ticks=5),
    title="Temperature (°C)",
    location=(0, 0),
)
p.add_layout(color_bar, "right")


# ─── Data fetch + update ───────────────────────────────────────────────────────
def fetch_and_update():
    new_cloud, new_temp, new_hum, new_pressure = [], [], [], []
    for city in cities:
        params = {
            "lat": city["lat"],
            "lon": city["lon"],
            "appid": API_KEY,
            "units": "metric",
        }
        try:
            data = requests.get(
                "https://api.openweathermap.org/data/2.5/weather", params=params
            ).json()
            clouds = data.get("clouds", {}).get("all", 0)
            temp = data.get("main", {}).get("temp", 0)
            hum = data.get("main", {}).get("humidity", 0)
            pressure = data.get("main", {}).get("pressure", 0)
        except Exception:
            clouds, temp, hum, pressure = 0, 0, 0, 0

        new_cloud.append(clouds)
        new_temp.append(temp)
        new_hum.append(hum)
        new_pressure.append(pressure)
    # Update all three columns at once
    source.data.update(
        cloud=new_cloud, temp=new_temp, humidity=new_hum, pressure=new_pressure
    )


# Initial load + periodic refresh
fetch_and_update()
curdoc().add_periodic_callback(fetch_and_update, UPDATE_INTERVAL_MS)

# Add to document
curdoc().add_root(p)
bokeh serve --show WM_app.py
(Nephele or Nεφέλη means “cloud” in Greek)