Log colorbar min/max update not triggered

I am trying to update the ColorBar to reflect a change in the data being displayed when the data is updated through a Select widget . I have associated log_cmap mapper to the glyph and the color bar but when updating .color_mapper.low / high the color bar update is not triggered (seems to be triggered next time the data is updated but then based on the old data). For comparison I also have a color bar with linear_cmap mapper, and this seems to update as expected when the on_change callback is executed. Not sure if I am updating the color bar incorrectly?

The example below got a Select widget for updating data, and another widget for choosing the mapper to use to color the data. When choosing to update the data the CDS is updated with new data and the callback for updating colorbar is called.

Running Bokeh 2.3.0, FireFox 78.9, RedHat 7.

#!/usr/bin/env python
import numpy as np
from bokeh.models import ColorBar, ColumnDataSource, NumeralTickFormatter
from bokeh.transform import linear_cmap, log_cmap
from bokeh.io import curdoc
from bokeh.plotting import figure
from bokeh.layouts import row, column
from bokeh.models.widgets import Select, Div
from bokeh.palettes import Spectral5, Reds5


src = ColumnDataSource(data = {'x': [], 'y': [], 'p1': [], 'p2': []})

MAPPER = {
    'linear': linear_cmap(field_name = 'p1', palette = Spectral5, low = 1, high = 6),
    'log': log_cmap(field_name = 'p2', palette = Reds5, low = 1, high = 1000),
}

def create_fig(mappers, title):
    p = figure(plot_width = 700, title = title, toolbar_location = 'above', match_aspect = True)
    p.min_border_left = 80
    p.circle(
        x = 'x', y = 'y', line_color = None, 
        color = mappers[map_select.value], 
        size=10, source=src, name = 'glyph'
    )
    p.xaxis[0].formatter = NumeralTickFormatter(format = '0')
    p.yaxis[0].formatter = NumeralTickFormatter(format = '0')

    for k,v in mappers.items():
        color_bar = ColorBar(color_mapper=v['transform'], width=8, name = 'color_bar_'+k)
        color_bar.visible = True
        p.add_layout(color_bar, 'right')

        if k != map_select.value:
            color_bar.visible = False

    return p


def color_bar_vis(attr, old, new):
    # callback for mapper select
    # hide and show correct colorbar
    cbar = plot.select(name = 'color_bar_'+old)
    cbar.visible = False

    cbar = plot.select(name = 'color_bar_'+new)
    cbar.visible = True
    
    # pick new mapper
    new_map = MAPPER[new]

    if new == 'linear':
        data_obj = src.data['p1']
    else:
        data_obj = src.data['p2']

    # update low and high values of mapper
    low = min(data_obj)
    high = max(data_obj)
    
    # update div widget with low/high of data to be mapped
    txt = 'Low: {:.4f}, high: {:.4f}'.format(low, high)
    info_text.text = txt

    new_map['transform'].low = low
    new_map['transform'].high = high

    cbar.color_mapper.low = low
    cbar.color_mapper.high = high

    r = plot.select(name = 'glyph')
    r.glyph.fill_color = dict(field = new_map['field'], transform = new_map['transform'])


def cb_data_select(attr, old, new):
    # callback for data factor select
    data_val = float(new)

    new_data = np.random.rand(4,70)
    x = new_data[0]*300+2000
    y = new_data[1]*300+3000
    p1 = new_data[2]*data_val / 2.0
    p2 = new_data[3]*data_val

    src.data = {'x': x, 'y': y, 'p1': p1, 'p2': p2}

    # update color mapper and colorbar to updated data
    # force update - assigning .value might not trigger callback
    color_bar_vis('value', map_select.value, map_select.value)


map_select = Select(
    title = 'Select mapper',
    options = list(MAPPER.keys()),
    value = list(MAPPER.keys())[0],
    width = 300
)
map_select.on_change('value', color_bar_vis)

plot = create_fig(MAPPER, 'Mapper from widget')

data_select = Select(
    title = 'Select data scaling factor',
    options = ['2', '50'],
)
data_select.on_change('value', cb_data_select)

info_text = Div(text = '', width = 300)
wdg_col = column(data_select, map_select, info_text)

data_select.value = '2'

curdoc().add_root(row(wdg_col, plot))
@Jonas_Grave_Kristens It’s not clear to me, is switching between linear and log part of your actual problem? If not please strip down the example code to a bare minimum, i.e. just what you want and expect to work, but does not work the way you expect. Everything else (including any extraneous formatting, styling, etc) is a distraction that makes things harder to diagnose quickly,

Sorry for giving such a complicated example… the min/max of the colorbar with log mapper updates fine in an example w/o the possibility to switch between the type of mapper to use. However my setup is a based on the needed for color mapping eiterh to a linear or log scale. But maybe I have set it up wrong

If you need to switch between linear and log I expect it will be much more successful to add two separate entire colorbars, one linear and the other log, and then toggle the visible properties of each as appropriate to show the one you want.

I am doing this in my example code above, I use visible to show either log or linear colorbar.

However, when I use the log_cmap the update of color_mapper.min and color_mapper.max is not triggered. It is however working fine for the linear colorbar. This is what puzzles me.

OK, I have tried to slim down the example. The setup is:

  • 1 plot with 2 ColorBar's
  • One colorbar with linear_cmap, another with log_cmap
  • Circle glyph uses mapper for fill_color (different field in CDS whether linear or log mapper)
  • widget for selecting dataset - used in order to update low/high of mappers and colorbars
  • callback updates the mapper to use based on map_select widget (in the example I on purpose do not hide any one of them)
  • In the mapper update function I loop both colorbars to force update of low/high of based on min/max of data

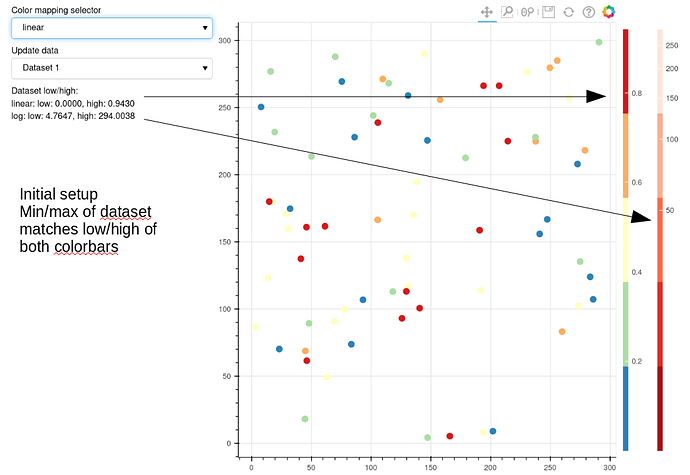
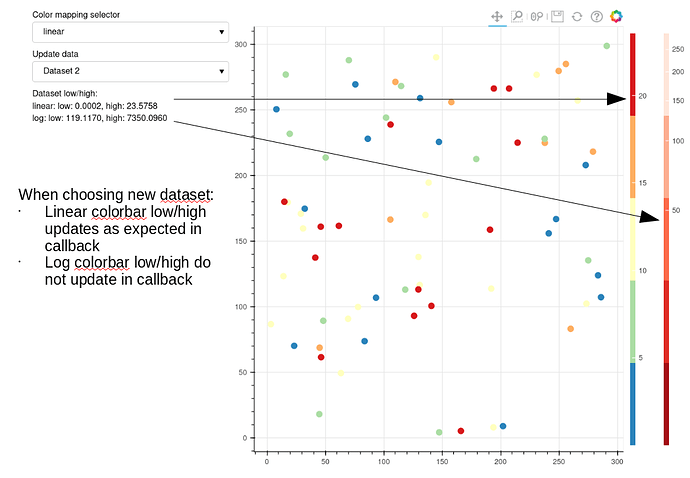
Picture 1 shows intitial setup where low/high of both colorbars match expected min/max of chosen dataset. If I choose a new dataset (picture 2) the callback for updating data and the updating mapper and colorbars is run, however, only the linear colorbars low/high seems to be triggered correctly. I would expect both colorbars to be updated since I run a loop and update .color_bar.low/high. But I might be doing this wrong with respect to updating colorbars?

    # loop the color bars and update low/high
    for item in ['linear', 'log']:
        if item == 'linear':
            field = 'val1'
            new_map = LINEAR_MAPPER
        else:
            field = 'val2'
            new_map = LOG_MAPPER

        data_obj = src.data[field]

        low = min(data_obj)
        high = max(data_obj)

        # update div widget with low/high of data to be mapped
        txt += item + ': low: {:.4f}, high: {:.4f}<br>'.format(low, high)
        info_text.text = txt

        cbar = plot.select(name = 'color_bar_'+item)

        cbar.color_mapper.low = low
        cbar.color_mapper.high = high

        # update mapper properties - should reflect mapper chosen
        if item == map_select.value:
            mapper = new_map 
            mapper['transform'].low = low
            mapper['transform'].high = high

#!/usr/bin/env python
import numpy as np
from bokeh.models import ColorBar, ColumnDataSource, NumeralTickFormatter
from bokeh.transform import linear_cmap, log_cmap
from bokeh.io import curdoc
from bokeh.plotting import figure
from bokeh.layouts import row, column
from bokeh.models.widgets import Select, Div
from bokeh.palettes import Spectral5, Reds5


DATA = np.random.rand(4,70)
x = DATA[0]*300
y = DATA[1]*300
ds1 = DATA[2]
ds2 = DATA[3]*300

src = ColumnDataSource(data = {'x': [], 'y': [], 'val1': [], 'val2': []})

LINEAR_MAPPER = linear_cmap(field_name = 'val1', palette = Spectral5, low = 1, high = 6)
LOG_MAPPER = log_cmap(field_name = 'val2', palette = Reds5, low = 1, high = 1000)

plot = figure(plot_width = 700, plot_height = 700, toolbar_location = 'above')
plot.circle(
    x = 'x', y = 'y', line_color = None, 
    fill_color = LINEAR_MAPPER, 
    size=10, source=src, name = 'glyph'
)

linear_color_bar = ColorBar(
    color_mapper = LINEAR_MAPPER['transform'],
    width = 8,
    name = 'color_bar_linear'
)
plot.add_layout(linear_color_bar, 'right')
#linear_color_bar.visible = True

log_color_bar = ColorBar(
    color_mapper = LOG_MAPPER['transform'],
    width = 8,
    name = 'color_bar_log'
)
plot.add_layout(log_color_bar, 'right')
#log_color_bar.visible = False


def color_bar_viz(attr, old, new):
    cbar = plot.select(name = 'color_bar_' + old)
    #cbar.visible = False

    cbar = plot.select(name = 'color_bar_' + new)
    #cbar.visible = True

    update_mapper()


def update_mapper():
    txt = 'Dataset low/high:<br>'

    # loop the color bars and update low/high
    for item in ['linear', 'log']:
        if item == 'linear':
            field = 'val1'
            new_map = LINEAR_MAPPER
        else:
            field = 'val2'
            new_map = LOG_MAPPER

        data_obj = src.data[field]

        low = min(data_obj)
        high = max(data_obj)

        # update div widget with low/high of data to be mapped
        txt += item + ': low: {:.4f}, high: {:.4f}<br>'.format(low, high)
        info_text.text = txt

        cbar = plot.select(name = 'color_bar_'+item)

        cbar.color_mapper.low = low
        cbar.color_mapper.high = high

        # update mapper properties - should reflect mapper chosen
        if item == map_select.value:
            mapper = new_map 
            mapper['transform'].low = low
            mapper['transform'].high = high
    

    r = plot.select(name = 'glyph')
    r[0].glyph.fill_color = dict(field = mapper['field'], transform = mapper['transform'])


def cb_data_select(attr, old, new):
    # callback for data factor select
    val1 = ds1
    val2 = ds2

    if new == 'Dataset 2':
        val1 = ds1*25
        val2 = ds2*25

    src.data = {'x': x, 'y': y, 'val1': val1, 'val2': val2}

    update_mapper()   

map_select = Select(
    title = 'Color mapping selector',
    options = ['linear', 'log'],
    value = 'linear'
)
map_select.on_change('value', color_bar_viz)

data_select = Select(
    title = 'Update data',
    options = ['Dataset 1', 'Dataset 2'],
)
data_select.on_change('value', cb_data_select)

info_text = Div(text = '', width = 300)
wdg_col = column(map_select, data_select, info_text)

data_select.value = 'Dataset 1'

curdoc().add_root(row(wdg_col, plot))
@Jonas_Grave_Kristens
Hi,

this is not a bokeh problem; from what I can tell your code is buggy.
I’m too tired to track the bug down (especially without a debugger) but I’m 75% the root cause it within your for-loop.

Here’s a lead: The problem will not occur if the first value in the for-in-loop iterable is not the same as map_selects initial value.
E.g.:

for item in ['log', 'linear']:
     # etc
....
map_select = Select(
    title='Color mapping selector',
    options=['linear', 'log'],
    value='linear')

Will work, same for value='log' and for item in ['linear', 'log']

Your version, value='linear' and for item in ['linear', 'log'] will leave the log-colorbar bugged.
The other option value='log' and for item in ['log', 'linear'] will leave the linear-colorbar bugged.

If you’re fine with something bad lingering in your code, for now, you can just swap the order.

Happy hunting

@kaprisonne thanks for taking the time looking into this! I understand what you mean, but I would not expect that this has any relation to the low/high of the colorbars as they are supposed to get updated in the for loop where I select the colobars and assign new values to the low/high (this is what I tried to indicate with picture 2).

I’m sorry, I am dealing with some family issues, so unfortunately I can’t really elaborate. But when I looked at the code a few days ago it also seemed to be using some anti-patterns. E.g I would suggest adding all the data up front and both glyphs and then hiding as appropriate. This avoids both re-sending all the data un-necessarily all the time, and is also just much simpler than trying to swap out mappers on a single glyph. (Glyphs objects are lightweight compared to data, so no reason not to just add both).

This is not “finished” but is still much more along the lines of whatI would write, myself:

#!/usr/bin/env python
import numpy as np
from bokeh.models import ColorBar, ColumnDataSource
from bokeh.transform import linear_cmap, log_cmap
from bokeh.io import curdoc
from bokeh.plotting import figure
from bokeh.layouts import row, column
from bokeh.models.widgets import Select, Div
from bokeh.palettes import Spectral5, Reds5

DATA = np.random.rand(4,70)
x, y = DATA[0]*300, DATA[1]*300
ds1, ds2 = DATA[2],  DATA[3]*300

src = ColumnDataSource(data={'x': x, 'y': y, 'val1_1': ds1, 'val2_1': ds2,  'val1_2': ds1*25, 'val2_2': ds2*25})

LINEAR_MAPPER = linear_cmap('val1_1', palette=Spectral5, low=1, high=300)
LOG_MAPPER = log_cmap('val2_1', palette=Reds5, low=1, high=1000)

plot = figure(toolbar_location='above')
linc = plot.circle('x', 'y', line_color=None, fill_color=LINEAR_MAPPER, size=10, source=src, name="linear")
logc = plot.circle('x', 'y', line_color=None, fill_color=LOG_MAPPER, size=10, source=src, name="log")
logc.visible = False

linear_bar = ColorBar(color_mapper=LINEAR_MAPPER['transform'], width=8, name="linear")
plot.add_layout(linear_bar, 'right')

log_bar = ColorBar(color_mapper=LOG_MAPPER['transform'], width=8, name="log", visible=False)
plot.add_layout(log_bar, 'right')

def color_bar_viz(attr, old, new):
    plot.select(old).visible = False
    plot.select(new).visible = True
    update_mapper()

def update_mapper():
    dataset = data_select.value

    if map_select.value == "linear":
        col = src.data[f"val1_{dataset}"]
        low, high = min(col), max(col)
        linear_bar.color_mapper.low = low
        linear_bar.color_mapper.high = high
        linc.glyph.fill_color = dict(LINEAR_MAPPER)

    else:
        col = src.data[f"val2_{dataset}"]
        low, high = min(col), max(col)
        log_bar.color_mapper.low = low
        log_bar.color_mapper.high = high
        logc.glyph.fill_color = dict(LOG_MAPPER)

def cb_data_select(attr, old, new):
    LINEAR_MAPPER["field"] = f"val1_{new}"
    LOG_MAPPER["field"] = f"val2_{new}"
    update_mapper()

map_select = Select( title='Color mapping', options=['linear', 'log'], value="linear")
map_select.on_change('value', color_bar_viz)

data_select = Select( title='Update data', options=['1', '2'], value="1")
data_select.on_change('value', cb_data_select)

update_mapper()

curdoc().add_root(row(column(map_select, data_select), plot))

After tripping over this as well I realized this very well might be a bug. Especially since it only happens if using server-side callbacks. (js works just fine)

How to reproduce:

  1. click on “greys” before you click on anything else
  2. hit “change min and max SERVER” → nothing happens
  3. hit “change min and max SERVER” again → the selected (right) colorbar changes its low & high visually (however that’s the old state that wasn’t displayed before, not the new one)
  4. click on “turbo” → the left colorbar weirdly changes its values to some other values (it is displaying the correct, new data, actually)
  5. click on “greys” again → the right colorbar finally changes its values to the state of the server-model
Snippet
from bokeh.io import curdoc
from bokeh.layouts import row, column
from bokeh.models import LinearColorMapper, ColorBar, ColumnDataSource, RadioButtonGroup, Button, CustomJS
import numpy as np
from bokeh.palettes import Turbo256, Greys256
from bokeh.plotting import figure

dataset = np.random.randint(100, size=(200, 200))
source = ColumnDataSource(data=dict(image=[dataset]))
_min = dataset.min()
_max = dataset.max()

cm1 = LinearColorMapper(palette=Turbo256, low=_min, high=_max)
cm2 = LinearColorMapper(palette=Greys256, low=_min, high=_max)

cbar1 = ColorBar(color_mapper=cm1)
cbar2 = ColorBar(color_mapper=cm2)

cm_cbar_dict = {"turbo": [cm1, cbar1], "greys": [cm2, cbar2]}

fig = figure(width=500, height=500)
img = fig.image(source=source, dw=200, dh=200, x=0, y=0, color_mapper=cm1)

fig.add_layout(cbar1, "right")
fig.add_layout(cbar2, "right")

btn = Button(label="change min and max SERVER")
btn_js = Button(label="change min and max JS")
radio = RadioButtonGroup(labels=list(cm_cbar_dict.keys()), active=0)


def change_cbar(idx):
    for index, val in enumerate(cm_cbar_dict.values()):
        if index == idx:
            #val[1].visible = True
            img.glyph.color_mapper = val[0]
        else:
            #val[1].visible = False
            pass

radio.on_click(change_cbar)


def change_min_max():
    low = np.random.randint(50)
    high = 100 - low
    #img.glyph.color_mapper.update(low=low, high=high)
    for val in cm_cbar_dict.values():
        val[0].update(low=low, high=high)
    #print(f"Set low to {low} and high to {high}")
btn.on_click(lambda x: change_min_max())

change_min_max_js = CustomJS(args=dict(cms=cm_cbar_dict),
                             code="""
                                var low = Math.random() * 50
                                var high = 100 - low
                                for (let key in cms){
                                    cms[key][0].low = low
                                    cms[key][0].high = high
                                }
                                console.log("set low to", low, "and high to", high)
                             """)
btn_js.js_on_click(change_min_max_js)


curdoc().add_root(row(column(btn, btn_js, radio), fig))

I’ll open a GitHub Issue about it: [BUG] ColorMapper does not update state in browser properly under certain circumstances · Issue #11303 · bokeh/bokeh · GitHub