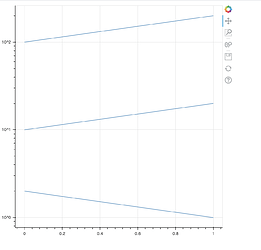
Hello!
I’m trying to plot data with a multi_line glyph and with the vertical axis being logarithmic.
The displayed plot is is autoscaled only on a small window of the available data. One can zoom out manually and see everything, but the default view eclipses some data. When using repeated calls for generating line glyphs, the vertical axis scales as expected. (To see that behaviour set the variable use_multiline to False) Also, when only one line is provided to the multi_line (reduce xs and ys to one element each), the range is selected correctly.
fig = figure(y_axis_type="log")
xs = [[0,1],[0,1],[0,1]]
ys = [[2,1],[100,200],[10,20]]

data = dict(xs= xs,
           ys= ys)

data_source = ColumnDataSource(data)

# Change this...
# ************************
use_multiline = True
# ************************
#

if use_multiline:
    fig.multi_line(xs="xs", ys="ys", source=data_source)
else:
    for x, y in zip(xs,ys):
        fig.line(x=x, y=y)

show(fig)
Is there a (simple) way to adjust the scaling with multi_line?
Follow-up/ Alternative:
In my project, I manage to get the Reset button to have the almost correct behaviour by adding a js_on_event(Reset, CustomJS…) that sets the y_range to start and end values determined manually.
js_for_reset = """
            logPlot.y_range.start = minStore.value;
            logPlot.y_range.end   = maxStore.value;
"""
self._log_plot.plot.js_on_event(Reset, CustomJS(args = dict(logPlot = self._log_plot.plot,
                                                                    minStore = self._minstorage,
                                                                    maxStore = self._maxstorage),
                                                   code=js_for_reset))
with self._(min/max)storage being invisible Spinners I just use to communicate the values from the Python side to the JS side, and Reset being bokeh.events.Reset.
However, even if I trigger the Reset call after the data-property ColumnDataSource has been changed, I still get to see the limited y_range. I guess that Bokeh does a autoscaling after all the calls related to the change of the data are done. Could I add a js_on_event call that is called after this autoscaling has been done? Is there an event like “the plot has been updated”?
