Hello~
How to solve the following problems? I tried many ways, but they didn’t work.
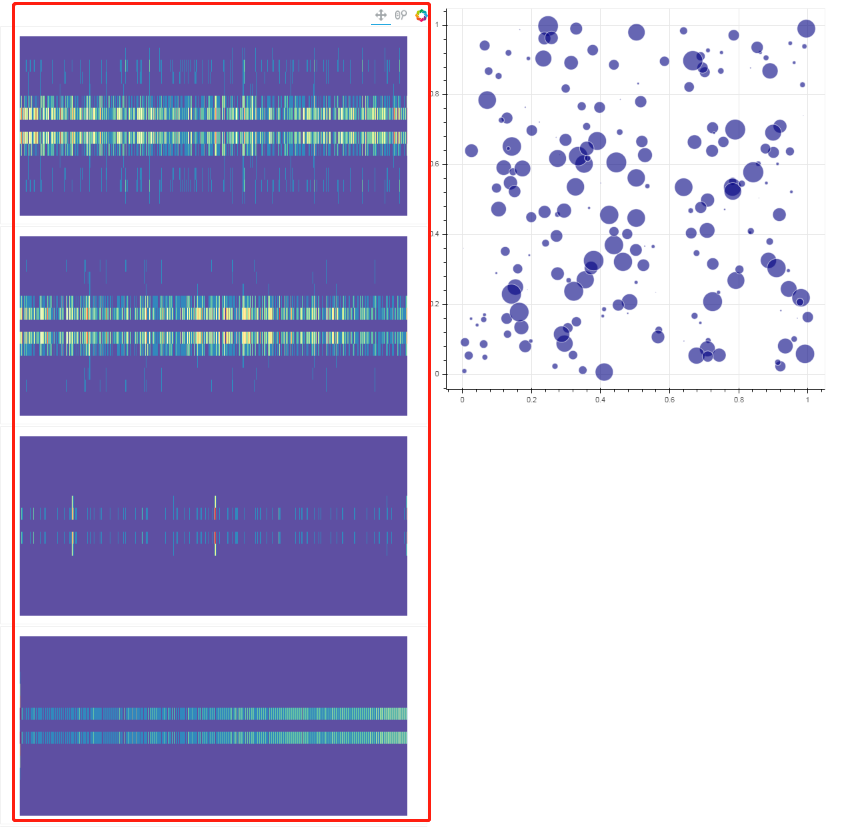
I have two pictures that can be displayed at the same height. The scale of the first picture is unchanged so that it can slide up and down, which is equivalent to the first picture embedded in the sub-page.
Hi Levin,
Can you explain what you want the final, fixed version to look like?
Hi,
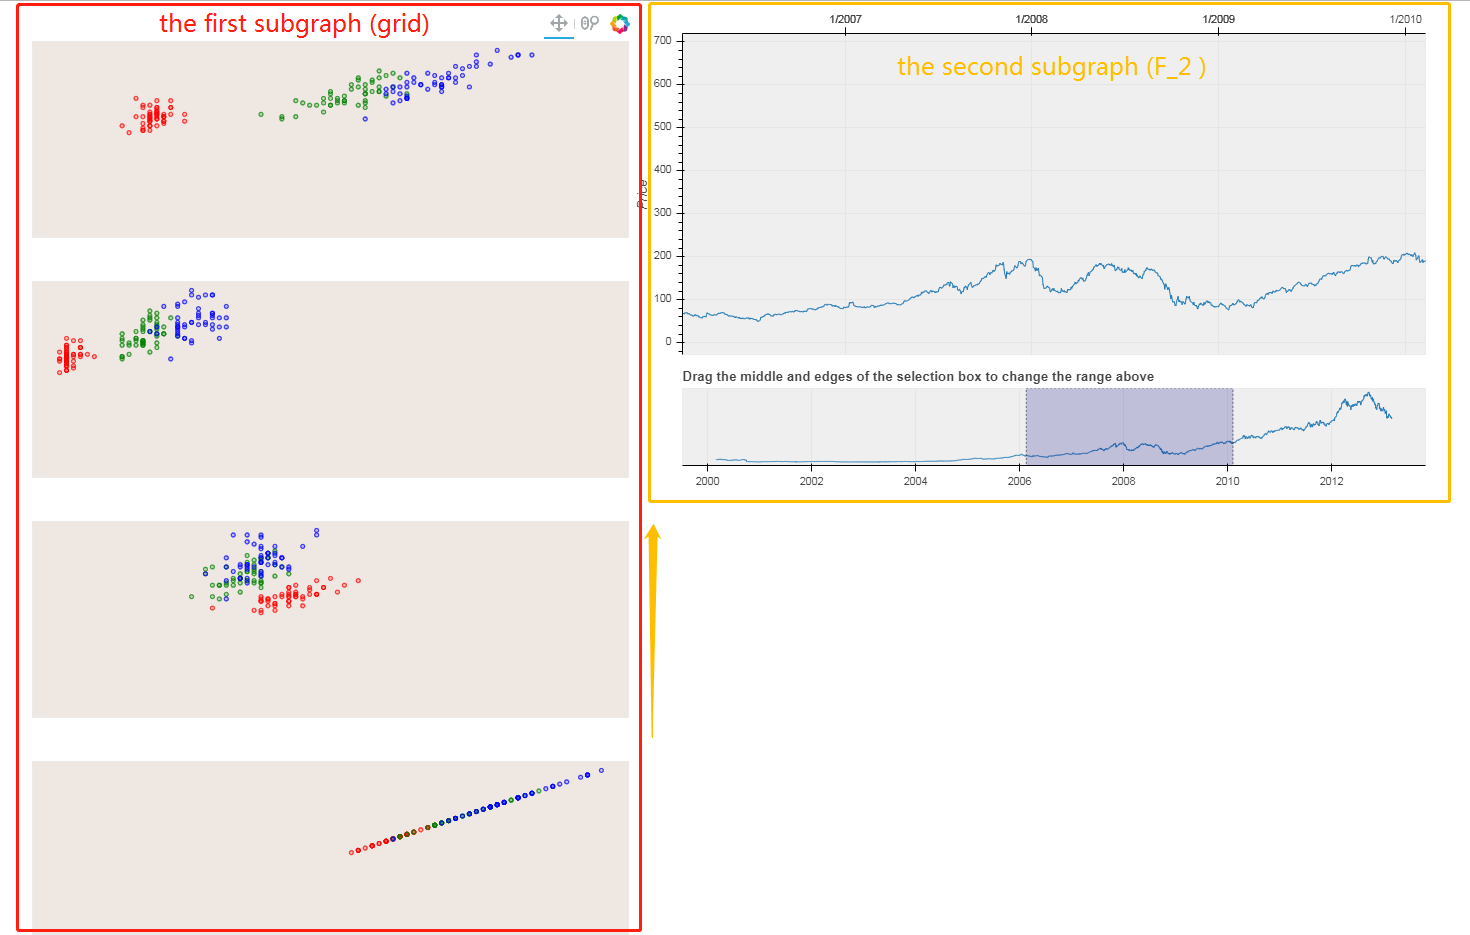
I hope the height of the two pictures is the same. The first one can slide up and down.As shown in the figure below.
Please share the code that creates the current layout.
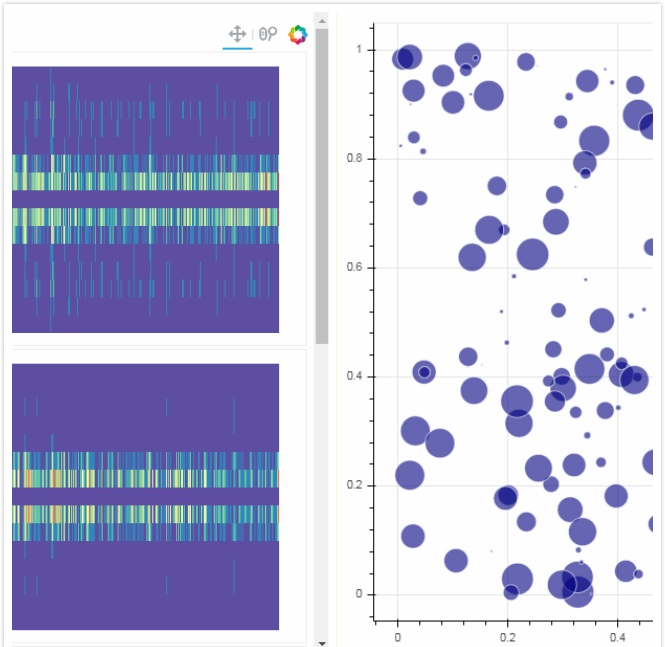
Sorry, I can’t write code to implement the layout of Figure 2. I can only implement the layout of Figure 1. But in order to express the requirements, Figure 2 is a tool I used to stitch together. I want to know if there is a way to embed the first subgraph of Figure 2.
I am asking for the code from figure 1, i.e. what you have tried so far.
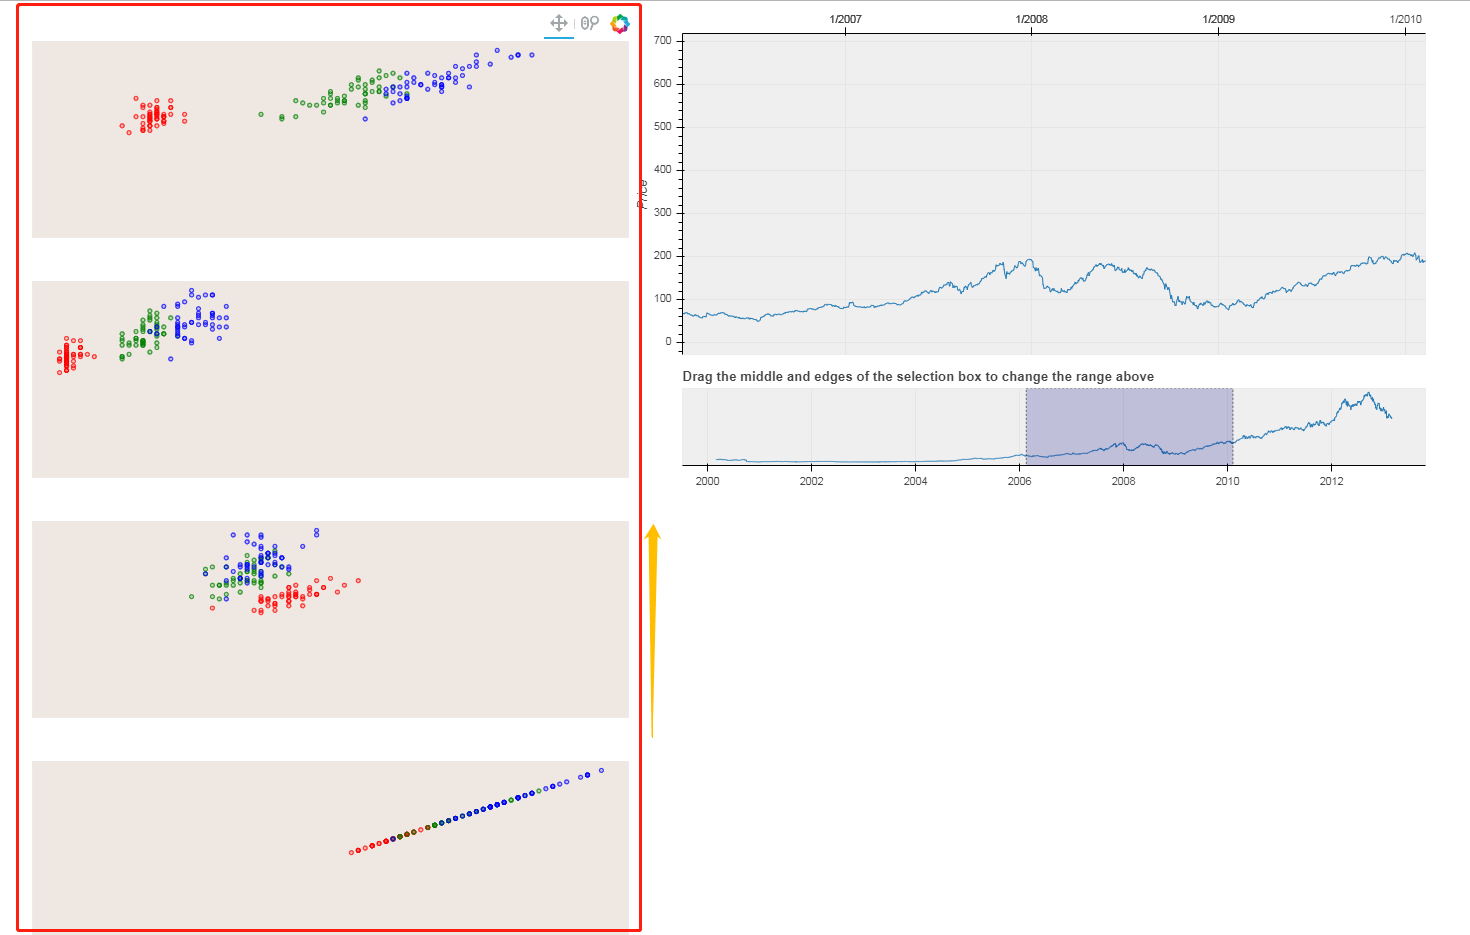
Here’s an example I quoted from the official website.
import numpy as np
from bokeh.plotting import figure
from bokeh.io import curdoc, show
from bokeh.layouts import gridplot, column,row
from bokeh.models.glyphs import Circle
from bokeh.models import (BasicTicker, ColumnDataSource, Grid, LinearAxis,
                          DataRange1d, PanTool, Plot, WheelZoomTool, RangeTool)
from bokeh.sampledata.iris import flowers
from bokeh.sampledata.stocks import AAPL

#############################################################################################################
#                                                     1                                                     #
#############################################################################################################
colormap = {'setosa': 'red', 'versicolor': 'green', 'virginica': 'blue'}

flowers['color'] = flowers['species'].map(lambda x: colormap[x])

source = ColumnDataSource(data=dict(petal_length=flowers['petal_length'],
                                    petal_width=flowers['petal_width'],
                                    sepal_length=flowers['sepal_length'],
                                    sepal_width=flowers['sepal_width'],
                                    color=flowers['color']))

xdr = DataRange1d(bounds=None)
ydr = DataRange1d(bounds=None)


def make_plot(xname, yname, xax=False, yax=False):
    mbl = 40
    mbb = 40
    plot = Plot(x_range=xdr,
                y_range=ydr,
                background_fill_color="#efe8e2",
                border_fill_color='white',
                plot_width=600 + mbl,
                plot_height=200 + mbb,
                min_border_left=2 + mbl,
                min_border_right=2,
                min_border_top=2,
                min_border_bottom=2 + mbb)

    circle = Circle(x=xname,
                    y=yname,
                    fill_color="color",
                    fill_alpha=0.2,
                    size=4,
                    line_color="color")
    r = plot.add_glyph(source, circle)

    xdr.renderers.append(r)
    ydr.renderers.append(r)

    plot.add_tools(PanTool(), WheelZoomTool())

    return plot


xattrs = ["petal_length", "petal_width", "sepal_width", "sepal_length"]
yattrs = list(reversed(xattrs))
plots = []

for y in yattrs:
    rows = []
    for x in xattrs:
        xax = (y == yattrs[-1])
        yax = (x == xattrs[0])
        plot = make_plot(x, y, xax, yax)
        rows.append([plot])
    plots.extend(rows)
grid = gridplot(plots)
#############################################################################################################
#                                                     2                                                     #
#############################################################################################################

dates = np.array(AAPL['date'], dtype=np.datetime64)
source = ColumnDataSource(data=dict(date=dates, close=AAPL['adj_close']))

p = figure(plot_height=350,
           plot_width=800,
           tools="xpan",
           toolbar_location=None,
           x_axis_type="datetime",
           x_axis_location="above",
           background_fill_color="#efefef",
           x_range=(dates[1500], dates[2500]))

p.line('date', 'close', source=source)
p.yaxis.axis_label = 'Price'

select = figure(
    title=
    "Drag the middle and edges of the selection box to change the range above",
    plot_height=130,
    plot_width=800,
    y_range=p.y_range,
    x_axis_type="datetime",
    y_axis_type=None,
    tools="",
    toolbar_location=None,
    background_fill_color="#efefef")

range_tool = RangeTool(x_range=p.x_range)
range_tool.overlay.fill_color = "navy"
range_tool.overlay.fill_alpha = 0.2

select.line('date', 'close', source=source)
select.ygrid.grid_line_color = None
select.add_tools(range_tool)
select.toolbar.active_multi = range_tool

F_2 = column(p, select)
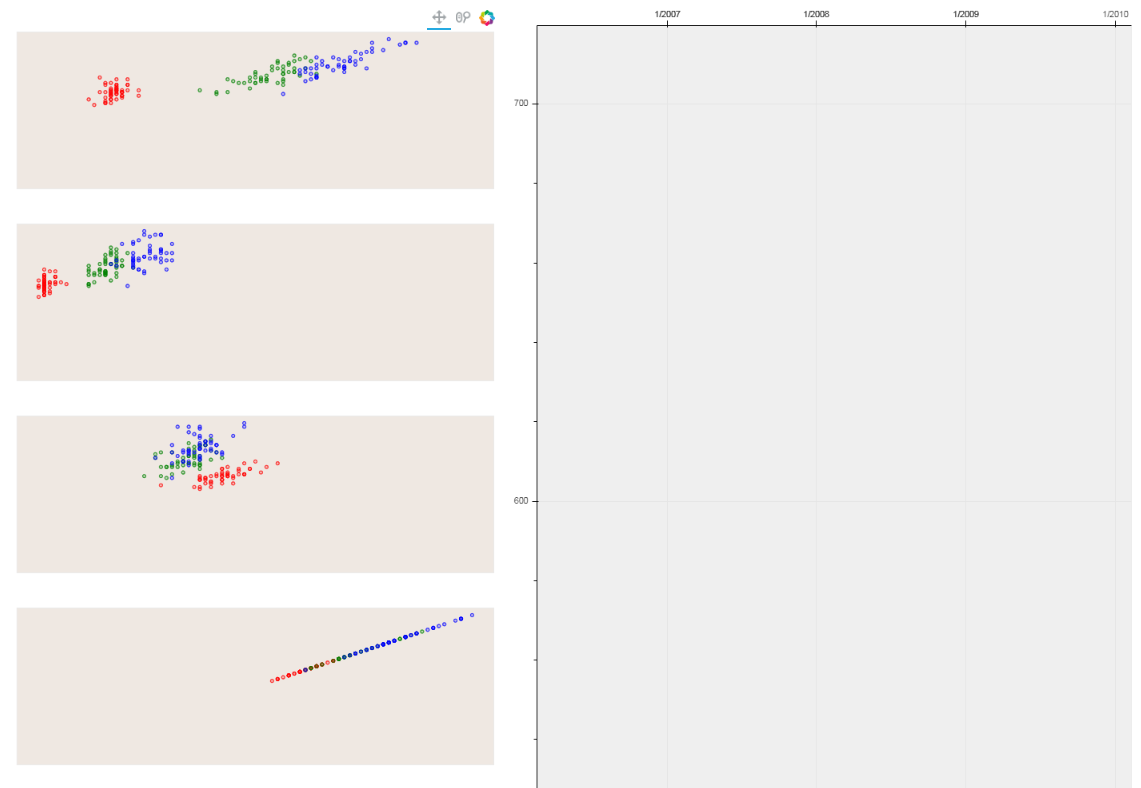
curdoc().add_root(row(grid,F_2))Pass sizing_mode="stretch_height" to the call p = figure(...)
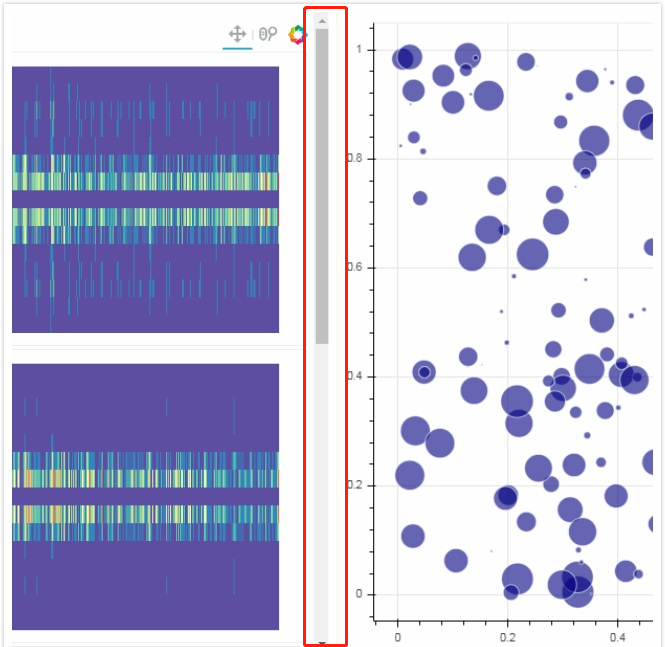
I tried, and the results are as follows, but not as I said. I want the frame height of the first subgraph to be the same as that of the second subgraph.
p = figure(plot_height=350,
           plot_width=800,
           tools="xpan",
           toolbar_location=None,
           x_axis_type="datetime",
           x_axis_location="above",
           background_fill_color="#efefef",
           x_range=(dates[1500], dates[2500]),
           sizing_mode="stretch_height")
As in the first subgraph in this picture, observation is achieved by dragging up and down in the red box.
Apologies, but I don’t really understand what you are after at all. There are lots of plots on your example image, so when you say “first subgraph” and “second subgraph” I don’t know what you are referring to (I thought I didn’t, but evidently I misunderstood)
Sorry, I didn’t describe the problem clearly. The GIF below is a combination of two web pages, but I want to achieve this splicing on one web.
If you want the height of the orange box to match the height of two of the plots on the left in the red box than AFAIK there are only two options:
-
Put those things in a
row. But that will break the scrolling you want. -
Adjust the fixed
plot_heightof the subplots in the orange box until they are exactly as tall as you want.
AFAIK there is no way to accomplish what you want without specifying the heights exactly on the right.
Thank you for your advice!