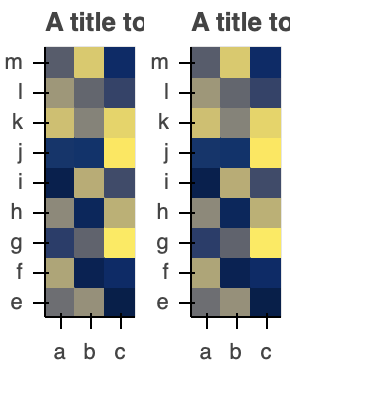
I am making a series of heatmaps with some being quite narrow (a couple blocks), I want them to have square blocks, so I am using the frame_widith and frame_height to basically set that exact right frame width and height to get the rectangles to be squares. This works, but if my is too long then it gets cut off, where I would like to have it take up some extra white space around it if needed for the title. (I am also turning off tools and toolbar since that isn’t wanted in my usecase). I have tried setting aspect ratio instead with a min width and height, but doesn’t keep the right aspect ratio
from bokeh.plotting import figure, show
from bokeh.transform import linear_cmap
from bokeh.layouts import row
import pandas as pd
import numpy as np

xs = ["a", "b", "c"]
ys = ["e", "f", "g", "h", "i", "j", "k", "l", "m"]

x = [x for x in xs for y in ys]
y = [y for x_ in xs for y in ys]

df = pd.DataFrame({"x": x,
                   "y": y,
                   "z": np.random.random(len(x))})

p = figure(
    frame_width=15 * len(df["x"].unique()), frame_height=15 * len(df["y"].unique()),
    toolbar_location=None,
    x_range=sorted(list(df["x"].unique())), y_range=list(df["y"].unique()),
    title="A title too long for this plot",
    # aspect_ratio=(len(df["x"].unique()) / len(df["y"].unique())),
)


fill_color = linear_cmap("z", palette="Cividis256", low=df["z"].min(), high=df["z"].max())

p.rect(x="x", y="y",
           width=1, height=1,
           source=df,
           color=fill_color,
           )

p2 = figure(
    frame_width=15 *len(df["x"].unique()), frame_height=15 *len(df["y"].unique()),
    toolbar_location=None,
    x_range=sorted(list(df["x"].unique())), y_range=list(df["y"].unique()),
    title="A title too long for this plot",
    # aspect_ratio=(len(df["x"].unique()) / len(df["y"].unique())),
)


fill_color2 = linear_cmap("z", palette="Cividis256", low=df["z"].min(), high=df["z"].max())

p2.rect(x="x", y="y",
           width=1, height=1,
           source=df,
           color=fill_color2,
           )

show(row(p, p2))
If I use aspect ratio with min_width and min_height then it doesn’t keep the square boxes
from bokeh.plotting import figure, show
from bokeh.transform import linear_cmap
from bokeh.layouts import row
import pandas as pd
import numpy as np

xs = ["a", "b", "c"]
ys = ["e", "f", "g", "h", "i", "j", "k", "l", "m"]

x = [x for x in xs for y in ys]
y = [y for x_ in xs for y in ys]

df = pd.DataFrame({"x": x,
                   "y": y,
                   "z": np.random.random(len(x))})

p = figure(
    min_width=len(df["x"].unique()), min_height=len(df["y"].unique()),
    toolbar_location=None,
    x_range=sorted(list(df["x"].unique())), y_range=list(df["y"].unique()),
    title="A title too long for this plot",
    aspect_ratio=(len(df["x"].unique()) / len(df["y"].unique())),
)

fill_color = linear_cmap("z", palette="Cividis256", low=df["z"].min(), high=df["z"].max())

p.rect(x="x", y="y",
           width=1, height=1,
           source=df,
           color=fill_color,
           )

p2 = figure(
    min_width=len(df["x"].unique()), min_height=len(df["y"].unique()),
    toolbar_location=None,
    x_range=sorted(list(df["x"].unique())), y_range=list(df["y"].unique()),
    title="A title too long for this plot",
    aspect_ratio=(len(df["x"].unique()) / len(df["y"].unique())),
)

fill_color2 = linear_cmap("z", palette="Cividis256", low=df["z"].min(), high=df["z"].max())

p2.rect(x="x", y="y",
           width=1, height=1,
           source=df,
           color=fill_color2,
           )

show(row(p, p2))
I also tried playing with width and height instead, min width/height max width/height, looking into the rectangle settings to see if there was something there, sizing modes, and nothing I looked into I could see what to do.
Any advice on how to keep the rectangles square while also if my title is too long have the plot provide some white space to either side before the next heatmap?
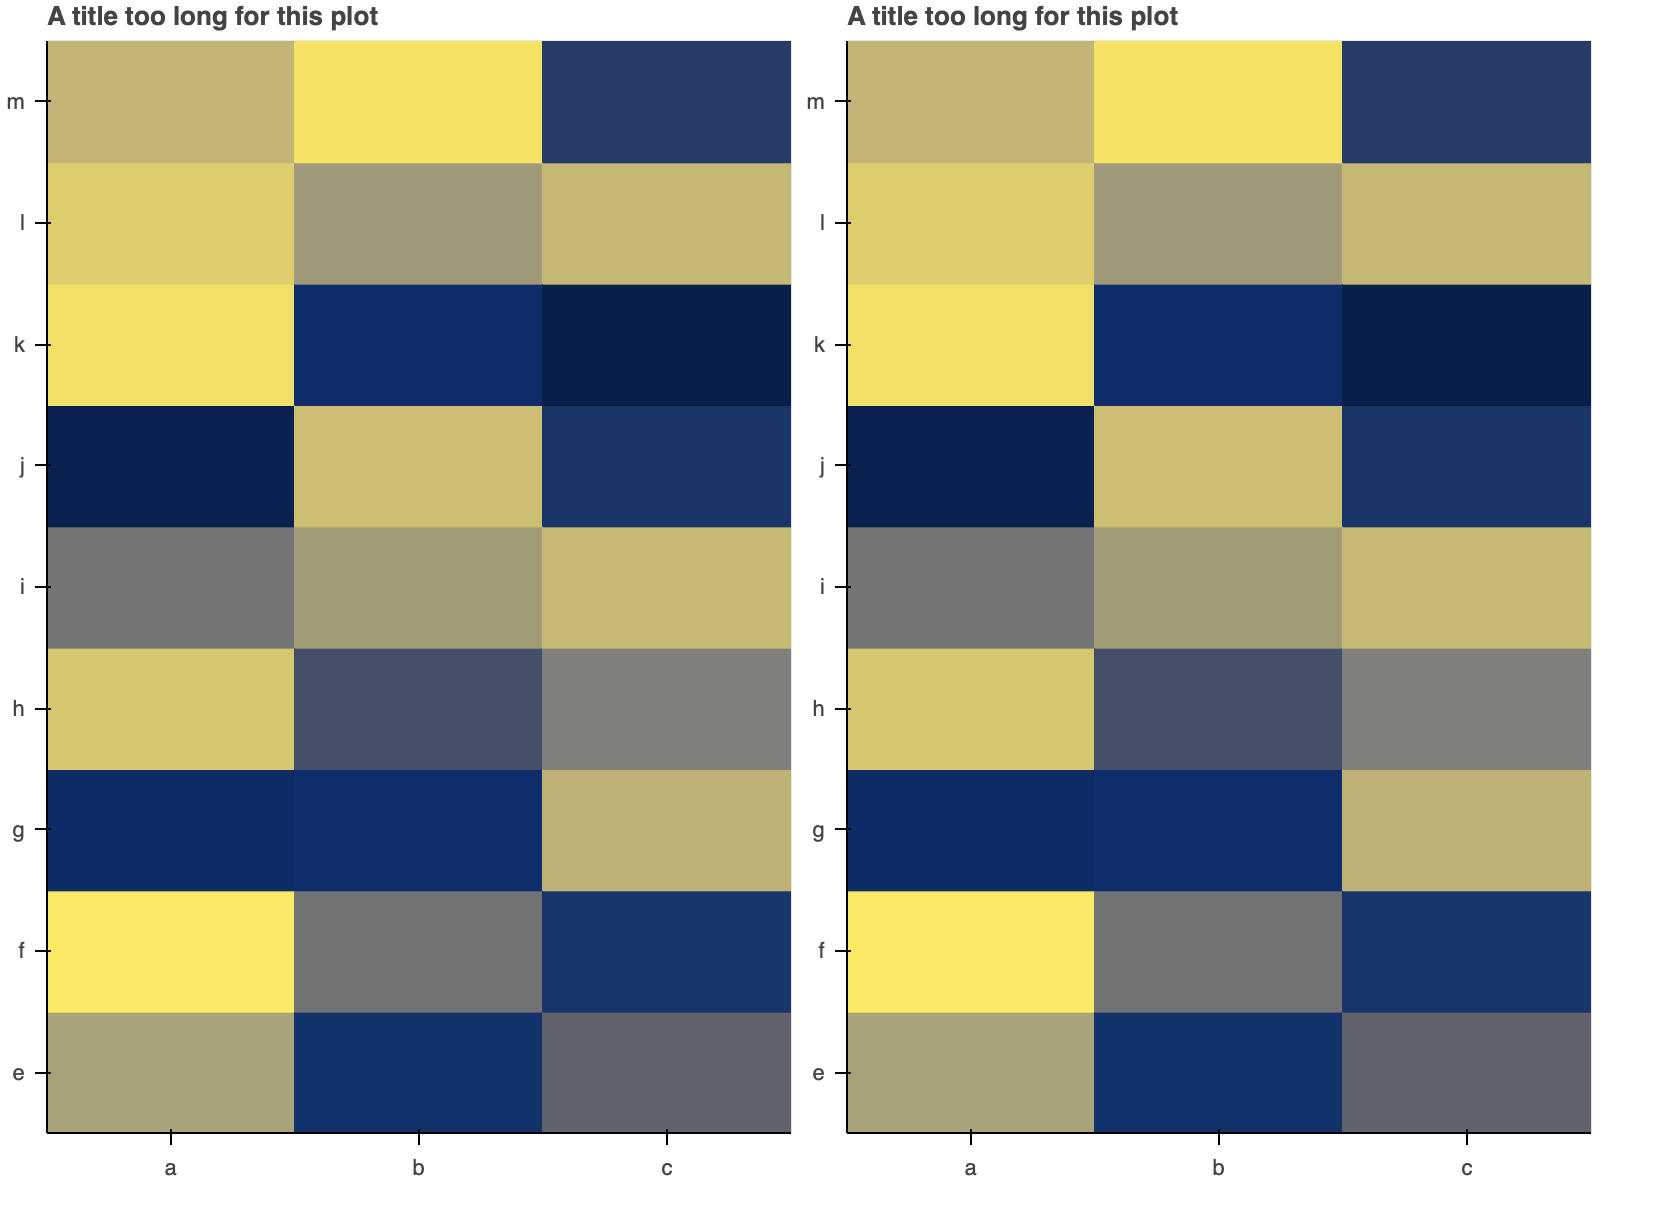
This is what I am going for more or less (I did this with panel, putting Markdown panes above the figure), but it isn’t ideal since it centers on the entire figure area (including labels and colorbars), not the frame area.