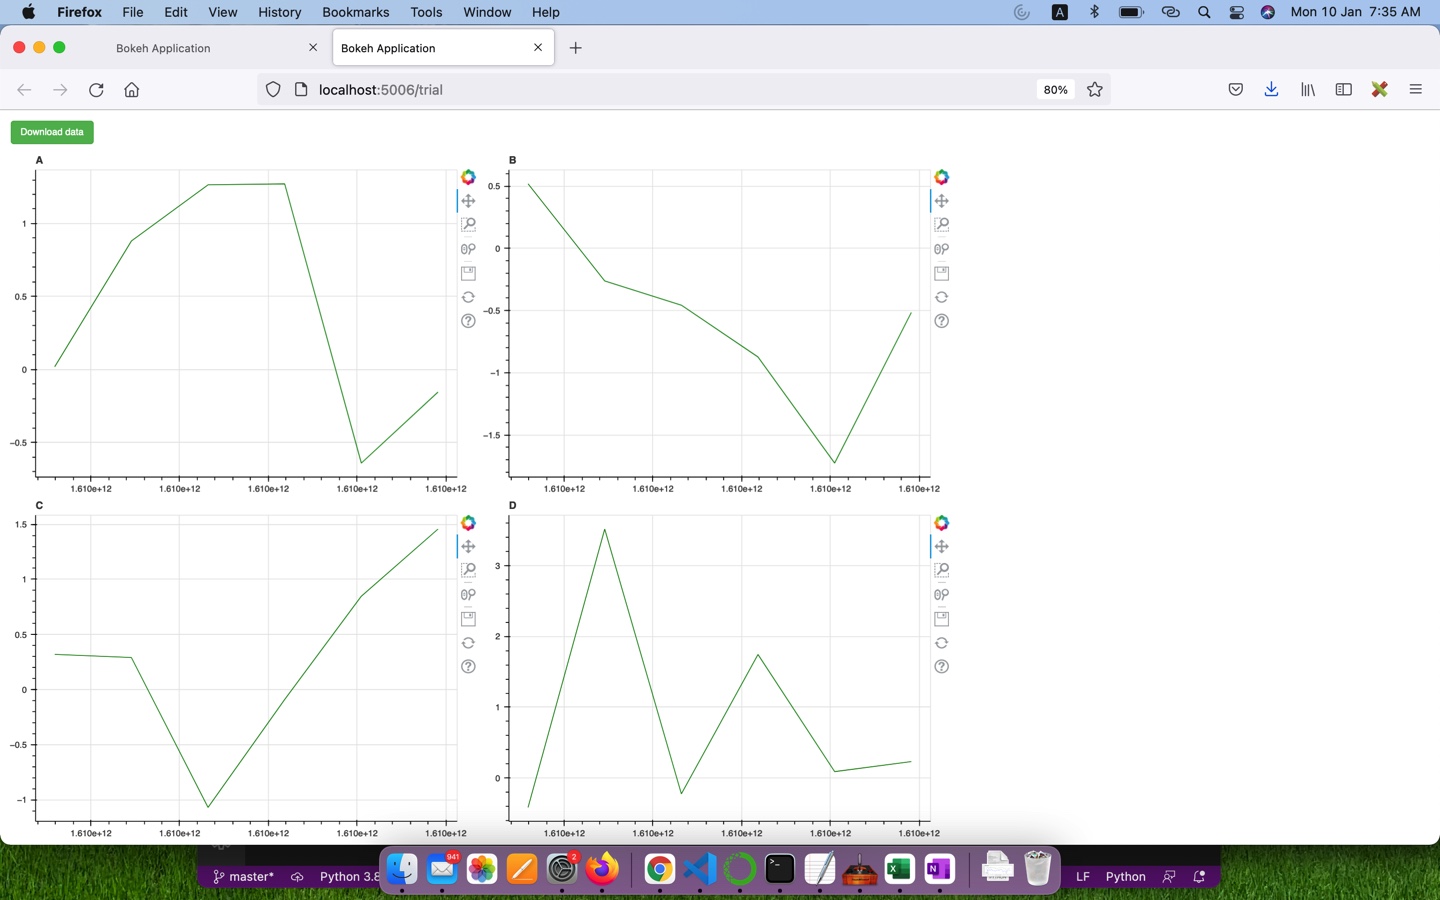
Hi, I have a gridplot that I want to fill the screen, and on its own I can use sizing_mode=‘stretch_both’ to achieve that. But when I add a button, the size of the gridplot changes so that it no longer matches the screen, and I haven’t been able to find a way to stop that from happening. Can I add a button while still maintaining the full-screen look of the gridplot?
Example code is here. The first screen shot the result from using curdoc().add_root(gridplot), the second from curdoc().add_root(column(button, gridplot)).
import pandas as pd
import numpy as np
from bokeh.plotting import figure, curdoc
from bokeh.models import ColumnDataSource
from bokeh.plotting import figure
from bokeh.models import Button
from bokeh.layouts import gridplot, column, row
from bokeh.io import export_png

dates = pd.date_range("20210101", periods=6)
df = pd.DataFrame(np.random.randn(6, 4), index=dates, columns=list("ABCD"))
df.rename_axis('Date', axis=0, inplace=True)

source = ColumnDataSource(df)

button = Button(label="Download data", button_type="success", height=30, width=80)

s1 = figure()
s1.title.text = "A"
s1.line(x='Date',
        y='A',
        source = source,
        color='green')

s2 = figure()
s2.title.text = 'B'
s2.line(x='Date',
        y='B',
        source = source,
        color='green')

s3 = figure()
s3.title.text = "C"
s3.line(x='Date',
        y='C',
        source = source,
        color='green')

s4 = figure()
s4.title.text = 'D'
s4.line(x='Date',
        y='D',
        source = source,
        color='green')

gridplot = gridplot([[s1, s2], [s3, s4]], sizing_mode='stretch_both', merge_tools=False)
#curdoc().add_root(gridplot)
curdoc().add_root(column(button, gridplot))