Is it possible to change the line_width of a hex_tile depending on the value of a field, for example line_width=3 if field “counts” > 100, else line_width=0. For the fill_color property I can use linear_cmap. Is there something for numerical properties aswell? Best would be without adding another column to my CDS.
Something like this, leveraging the amazingness of CustomJSTransform:
from bokeh.plotting import figure, show
from bokeh.transform import transform
from bokeh.models import ColumnDataSource, HexTile, CustomJSTransform
source = ColumnDataSource(dict(
q=[0, 0, -1, -1, 1, 1, 0],
r=[0, -1, 0, 1, -1, 0, 1],
counts=[199,205,301,500,150]
)
)
plot = figure(width=300, height=300)
#create a customjstransform that goes through the array of counts and populates an array of widths
width_transform = CustomJSTransform(v_func='''
var widths = []
//variable xs corresponds to the array corresponding to the assigned field_name in the transform
//so in this case xs will be the array of counts
for (var i=0;i<xs.length;i++){
if (xs[i] > 300){
widths.push(8)
}
else {widths.push(0)}
}
return widths
''')
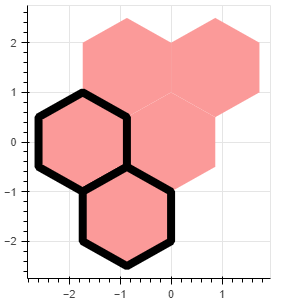
r = plot.hex_tile(q="q", r="r", size=1, fill_color="#fb9a99", line_color="black"
,line_width=transform(field_name='counts',transform=width_transform) #assign the transform to the line_widths property
,source=source)
show(plot)