I’m new to bokeh and data analytics. After the data cleaning process I’m trying to create a map to display the number of releases of Netflix content in each country.
My dataframe Mergedgdf before converting to json is:
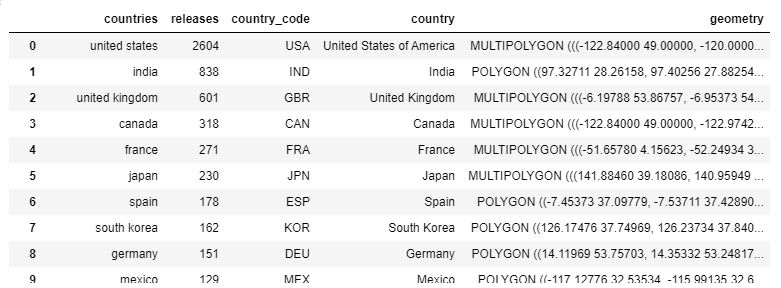
code used -
import json
merged_json=json.loads(mergedGdf.to_json(default_handler=str))
json_data=json.dumps(merged_json)
from bokeh.io import output_notebook,show, output_file
from bokeh.plotting import figure,output_file,show
from bokeh.models import GeoJSONDataSource, LinearColorMapper, ColorBar
from bokeh.palettes import brewer
from bokeh.models import Slider, HoverTool
from bokeh.sampledata.sample_geojson import geojson ###
from bokeh.io import curdoc, output_notebook
#from bokeh.models import Slider, HoverTool
from bokeh.layouts import widgetbox, row, column
#geojson is used for plotting using xs and ys cordinates
geosource=GeoJSONDataSource(geojson=json_data)

palette=brewer['YlGnBu'][8] #defining the color for visuals
palette=palette[::-1] #reversing the color order so the most obese is blue

#linear color mapper is useful in mapping the values linearrly to colors
color_mapper=LinearColorMapper(palette=palette,low=0,high=2600)
hover = HoverTool(tooltips = [('Country/region','@country'),('Releases', '@releases')])

#Create color bar.
color_bar = ColorBar(color_mapper=color_mapper, label_standoff=8,width = 500, height = 20,
border_line_color=None,location = (0,0), orientation = 'horizontal')
#Create figure object.
p = figure(title = 'country wise release numbers', plot_height = 600 , plot_width = 950, toolbar_location = None, tools=[hover])
p.xgrid.grid_line_color = None
p.ygrid.grid_line_color = None
#Add patch renderer to figure.
p.patches('xs','ys', source = geosource,fill_color = {'field' : 'releases', 'transform' : color_mapper},
          line_color = 'black', line_width = 0.25, fill_alpha = 1)
#Specify figure layout.
p.add_layout(color_bar, 'below')
#Display figure inline in Jupyter Notebook.
output_notebook()
#Display figure.
show(p)
my kaggle notebook www.kaggle .com/ aswinbabu/netflix-time
Please tell me how to display the map`
`