Mean over N dynamic graph points

Hello coder friend!

I discovered the bokeh libraries and its uses, but I have been blocking for two days now on something that will surely seem trivial to you.

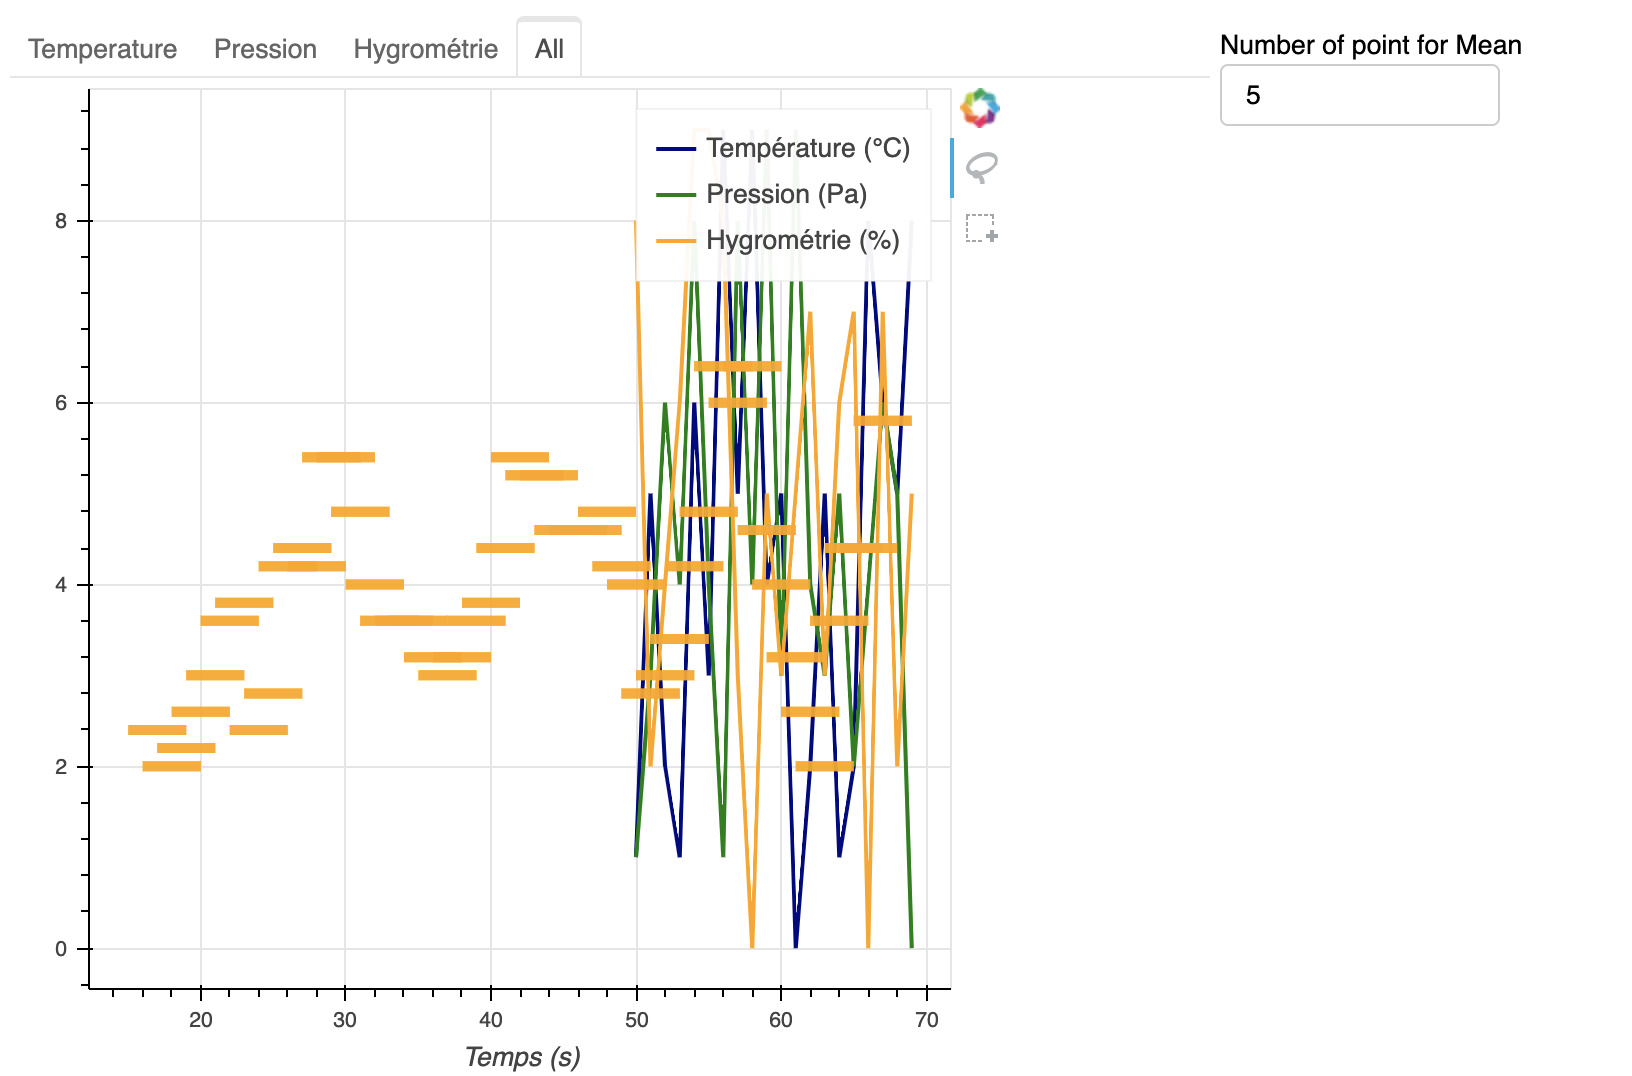
I want to average over N points which I recover via an “inputAverage” and then plot a line on the graph (which is dynamic)
but i didnt know how to get value of “nAverage”… As you can see, nAverage gonna keep her value of “0”… I dont know why… Could u help me please ? :slight_smile:

from bokeh.plotting import figure, output_file
from bokeh.models import Panel, Tabs
import numpy as np
import math
from bokeh.io import curdoc
from bokeh.io import output_notebook, show
output_notebook()
from bokeh.layouts import column, row
from bokeh.models.widgets import TextInput, Button, Paragraph
from bokeh.models import CheckboxButtonGroup,PreText,Select,CustomJS, ColumnDataSource, Slider, Panel, Tabs
from random import *
from bokeh.driving import count


#bokeh serve --show Interface1.py

UPDATE_INTERVAL = 250
ROLLOVER = 20

def DrowAverageSelected(x, y, plot):
    if nAverage != 0 :     
        ymoy = sum(y) / len(y)    
        plot.line(x, ymoy, color="orange", line_width=5, alpha=0.6)
    else:
        return
    
def CreateFigure (labelY, labelX, color, source, w=600, h=300, legend=None):
#p.y_range = Range1d(0, 45)
    fig = figure(plot_width=w, plot_height=h, tools=["box_select","lasso_select"])
    fig.xaxis.axis_label = labelX
    fig.yaxis.axis_label = labelY
    
    if (legend == None) :
        fig.line('x', 'y',source=source,line_width=2, line_color=color)
    else :
        for i in range (len(legend)) :
            fig.line('x', 'y',source=source[i], line_width=2, line_color=colors[i], legend_label=legend[i])
    
    # if (xmoy != None and ymoy != None):
    #     fig.circle('x', 'y', color='color', size=8, alpha=0.4, source=xmoy, selection_color="firebrick", selection_alpha=0.4)
    #     DrowAverageSelected(x,y,fig,xmoy,ymoy)
    
    return fig

@count()
def update(x):
    global source, X, Y, figure
    for i in range (len(source)):
        source[i].stream({"x": [x], "y": [int(random()*10)]}, rollover=ROLLOVER)
        if inputAverage.value.isdigit():
            nAverage = int(inputAverage.value)
        else: 
            nAverage = 0
        DrowAverageSelected(X[-nAverage:], Y[-nAverage:],figure)

def CallbackInputNAverage(attr,old, new):
    global nAverage
    nAverage = int(new)
    print(nAverage, new)
    
source = [ColumnDataSource({"x": [], "y": []})]
source += [ColumnDataSource({"x": [], "y": []})]
source += [ColumnDataSource({"x": [], "y": []})] 
  
nAverage = 0    

inputAverage = TextInput(title="Number of point for Mean")
inputAverage.on_change('value', CallbackInputNAverage)#lamba : création d'une fonction sans passer par def
inputs = column(inputAverage, width=150, height=150)
 
X = source[0].data['x']
Y = source[0].data['y']

tab = []

fig = CreateFigure('Température (°C)', 'Temps (s)', 'navy', source[0])
tab += [Panel(child=fig, title="Temperature")]

fig = CreateFigure('Pression (Pa)', 'Temps (s)', 'green', source[1])
tab += [Panel(child=fig, title="Pression")]

fig = CreateFigure('Hygrométrie (%)', 'Temps (s)', 'orange', source[2])
tab += [Panel(child=fig, title="Hygrométrie")]

lasso = ["box_select","lasso_select"]

legend = ['Température (°C)', 'Pression (Pa)', 'Hygrométrie (%)']
colors = ['navy', 'green', 'orange']
fig = CreateFigure('', 'Temps (s)', colors, source, w=500, h=500, legend=legend)
tab += [Panel(child=fig, title="All")]

    #Layout
tabs = Tabs(tabs=tab)
interface1=row(tabs,inputs)
    
    #curdoc
doc=curdoc() #il va recréer un nouveau document a chaque fois
doc.add_root(interface1)
doc.add_periodic_callback(update, UPDATE_INTERVAL)``

@Aemeris

Bokeh is a great environment with many users that are willing to provide help. To increase the likelihood of meaningful assistance, and to reduce the iterations to get to a solution, it would help to have code that runs without error or highlights the error that’s giving you problems.

For the code attached to this topic, the following things stand out on a quick inspection.

  1. There are a lot of redundant imports that should be pared back.

  2. This line is generally dangerous. You are masking a core bokeh model type figure (see import statements) by redefining/assigning it to a variable of the same name.

figure = fig

  1. Also, there are variables that might be important to the intended behavior that seem to be missing. An example is director_val in the CallbackInputNAverage() callback. The color variable in the AverageSourceXmoy() function also seems to be unavailable locally, but that might just be a plot formatting/styling issue that is tangential to the problem of interest.

  2. How are you running the application? You have native python callbacks, which means running via bokeh serve is required.

  3. I unsuccessfully tried to clean up a few of these things and run the code via bokeh serve. I saw a dynamically updating plot, but when I entered a value for the “Number of point for mean” edit box, the server console gives an error about an undefined director_val variable mentioned above in #3.

  1. I have a little clean imports now it’s true that I forgot to do it, thank you for reminding me to do it.

  2. it’s a fail from a old test, normally it can run without, I have not affected this variable elsewhere

  3. same, i clean it normally (i edit on top)

  4. i run application with : bokeh serve --show example.py in my cmd

  5. I dont have any error about an undefined director_val, could u show me her ? pls

thank you for taking the time to read me and answer me

The original code included this as the callback function, and the director_val quantity does not exist anywhere else in the code.

def CallbackInputNAverage(attr,old, new):
    global nAverage
    nAverage = int(new)
    print(nAverage, new)
    if (director_val != ""):
        selected = selected[selected.Director.str.contains(director_val)==True]

Consequently, when it is run, and an entry is made in the edit box, it generates the following error on the terminal console where the server is running. (I run from a bash prompt in Linux or a terminal prompt in OSX. Don’t know about Windows.)

..., in CallbackInputNAverage
    if (director_val != ""):
NameError: name 'director_val' is not defined

It looks like that part of the code was removed in an edit to the post.

@Aemeris

The revised code fails albeit differently.

There is an update function that currently has the following implementation. Note that the figure “variable” that you’re passing around is not actual an instance of a bokeh model but the core model type that you’re importing.

@count()
def update(x):
    global source, X, Y, figure
    for i in range (len(source)):
        source[i].stream({"x": [x], "y": [int(random()*10)]}, rollover=ROLLOVER)
        if inputAverage.value.isdigit():
            nAverage = int(inputAverage.value)
        else: 
            nAverage = 0
        DrowAverageSelected(X[-nAverage:], Y[-nAverage:],figure)

This cause the program to crash when that argument is passed to DrowAverageSelected(), because the figure quantity doesn’t have a line property attribute.

If one changes the variable in the update function to fig, both in the global statement and in the call to DrowAverageSelected(), orange horizontal line segments show up on the last plot under the “All” tab.

The reason that it is showing up on the last plot only is because you reuse the fig variable for the rendered when you create all of the plots, so the fig variable is associated with the last plot only.

I have no way of knowing if it shows up where you want, and there are other peculiarities that you’ll need to track down. The text input callback doesn’t seem to work after the first entry, for example.

Hello, thank you for your answer!

For the moment I wish to make it appear on a graph, after it is all or not, it does not matter that much.

I didn’t quite understand what you were doing here, did you show the code please?

Blockquote
If one changes the variable in the update function to fig , both in the global statement and in the call to DrowAverageSelected() , orange horizontal line segments show up on the last plot under the “All” tab.

one side of that I tried to code a quick little trick to know if I could recover “nAverage” however it turns out that no, did you detail the method to do it please? : o

here is what i realized:

def update():
    df = select_movies()
    print(df)
    
def select_movies():
    director_val = director.value.strip()  
    return selected

director = TextInput(title="Director name contains")
director.on_change('value', lambda attr, old, new: update())
doc=curdoc() 
doc.add_root(director)```

i didnt realize the print of "df" :confused:

@Aemeris

The edited code did not run for me because it was referencing figure, which is a bokeh import in what you’ve provide. It is not a specific instance of a figure. To get around that, I minimally modified this part of your code. See the two lines that I replaced with pre- and post- comments of #<original> and #<modified>, respectively.

@count()
def update(x):
    #<original> global source, X, Y, figure
    global source, X, Y, fig #<modified>
    for i in range (len(source)):
        source[i].stream({"x": [x], "y": [int(random()*10)]}, rollover=ROLLOVER)
        if inputAverage.value.isdigit():
            nAverage = int(inputAverage.value)
        else: 
            nAverage = 0
        #<original> DrowAverageSelected(X[-nAverage:], Y[-nAverage:],figure)
        DrowAverageSelected(X[-nAverage:], Y[-nAverage:],fig) #<modified>

With that minimal change, I ran via bokeh serve, put “5” as the value for the mean box, and saw the horizontal line appear in the last plot, as mentioned. Here’s a snapshot.


Beyond that quick inspection, I didn’t do any more. Not sure what the new functions in your most recent post signify, but in general it helps to have a complete self-contained minimal reproducer file so that others can help efficiently.

Hello,
the concern is that I thought that the problem with my program was the fact of receiving the “5” (that you notified), that’s why I made a new piece of program.

However next to that I replaced what you had changed, however I get this:

https://imgur.com/a/dgVMxi4

I would like to work from what you have as a result, however, I don’t know why I don’t have the same result at all :confused:

Not sure what is different. I simply started with the most recent version of the code in your post and changed the two lines to intentionally make minimal modifications to what you have. It runs similarly for me in bokeh v1.4.0 and v2.0.2 via bokeh --serve.

The figure you attached most recently has something that stands out. It shows an x-axis with range [410,429]. When I run your code, the axis continues to compress (and x-axis range grows) with each periodic update. The system also progressively slows down. I figured that was how the data are being streamed, but I wasn’t going to go down the rabbit hole of trying to redesign the application.

I think the best thing again is to provide a complete file that you’re running and explicitly state any relevant parts of the environment you’re using in case that prompts any ideas. Bokeh version, web browser for the client, any messages/errors in the console, etc.

the default application for internet was edge suddenly the localhost opened on edge, and in fact, it did not receive the “5” because for I do not know that it is right on cannot “input” on edge. …
Thx for assist,and the time you took to answer me.