Hey! I’m have a little problem
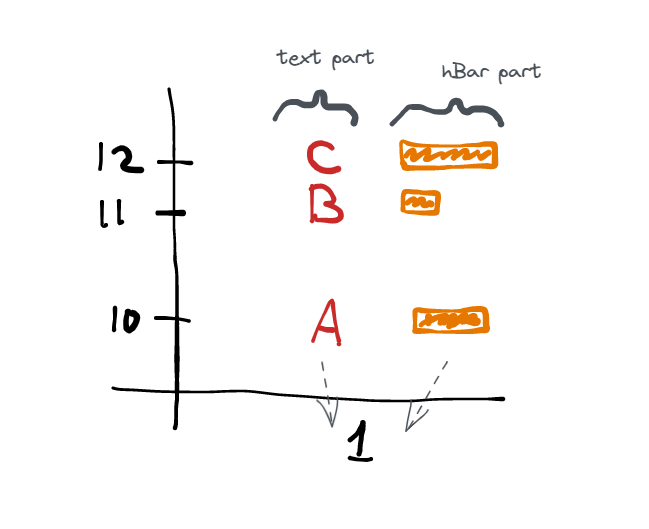
I have two sets of data, (which have the same y part but different x parts) I would like them to look as if they have the same x part. Is this possible?
The first part of my data is just text, the second part is horizontal bars, I know we need to add extra axes somehow, but the problem is I don’t know how to scale them, and I also don’t know what the maximum range is (although if we can’t do without it, we can set it to 1,000,000)
Here is an example on the picture that shows what you would like to have at the end:
from bokeh.plotting import figure, save
from bokeh.models import Rect, LabelSet, ColumnDataSource
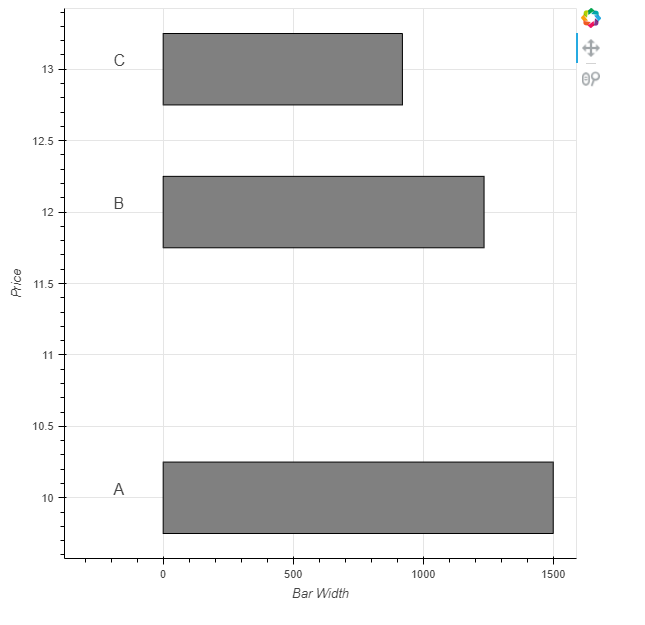
p = figure(tools=['pan','wheel_zoom'],x_axis_label='Bar Width',y_axis_label='Price')
#storing bar widths outside of dict because we need to calculate their "centre" for the Rect glyph
bar_widths = [1500,1234,920]
all_data = {
'day' : [1, 1, 1],
'price' : [10, 12, 13],
'str' : ["A", "B", "C"],
'bar_width' : bar_widths,
'x_centers': [x/2 for x in bar_widths] #basic math to shift each bar's center so that its left end is always at 0
}
source = ColumnDataSource(data=all_data)
#create rect glyph with mix of args, most will point to a field in the datasource, but height is hard coded (could be made adjustable just by adding it to your source)
bar_glyph = Rect(x='x_centers',y='price',width='bar_width',height=0.5)
p.add_glyph(source,bar_glyph)
#create labelset annotation in similar fashion
lset = LabelSet(x='day',y='price',text='str',x_offset=-50,source=source,render_mode='canvas')
p.add_layout(lset)
save(p,'dummy.html')