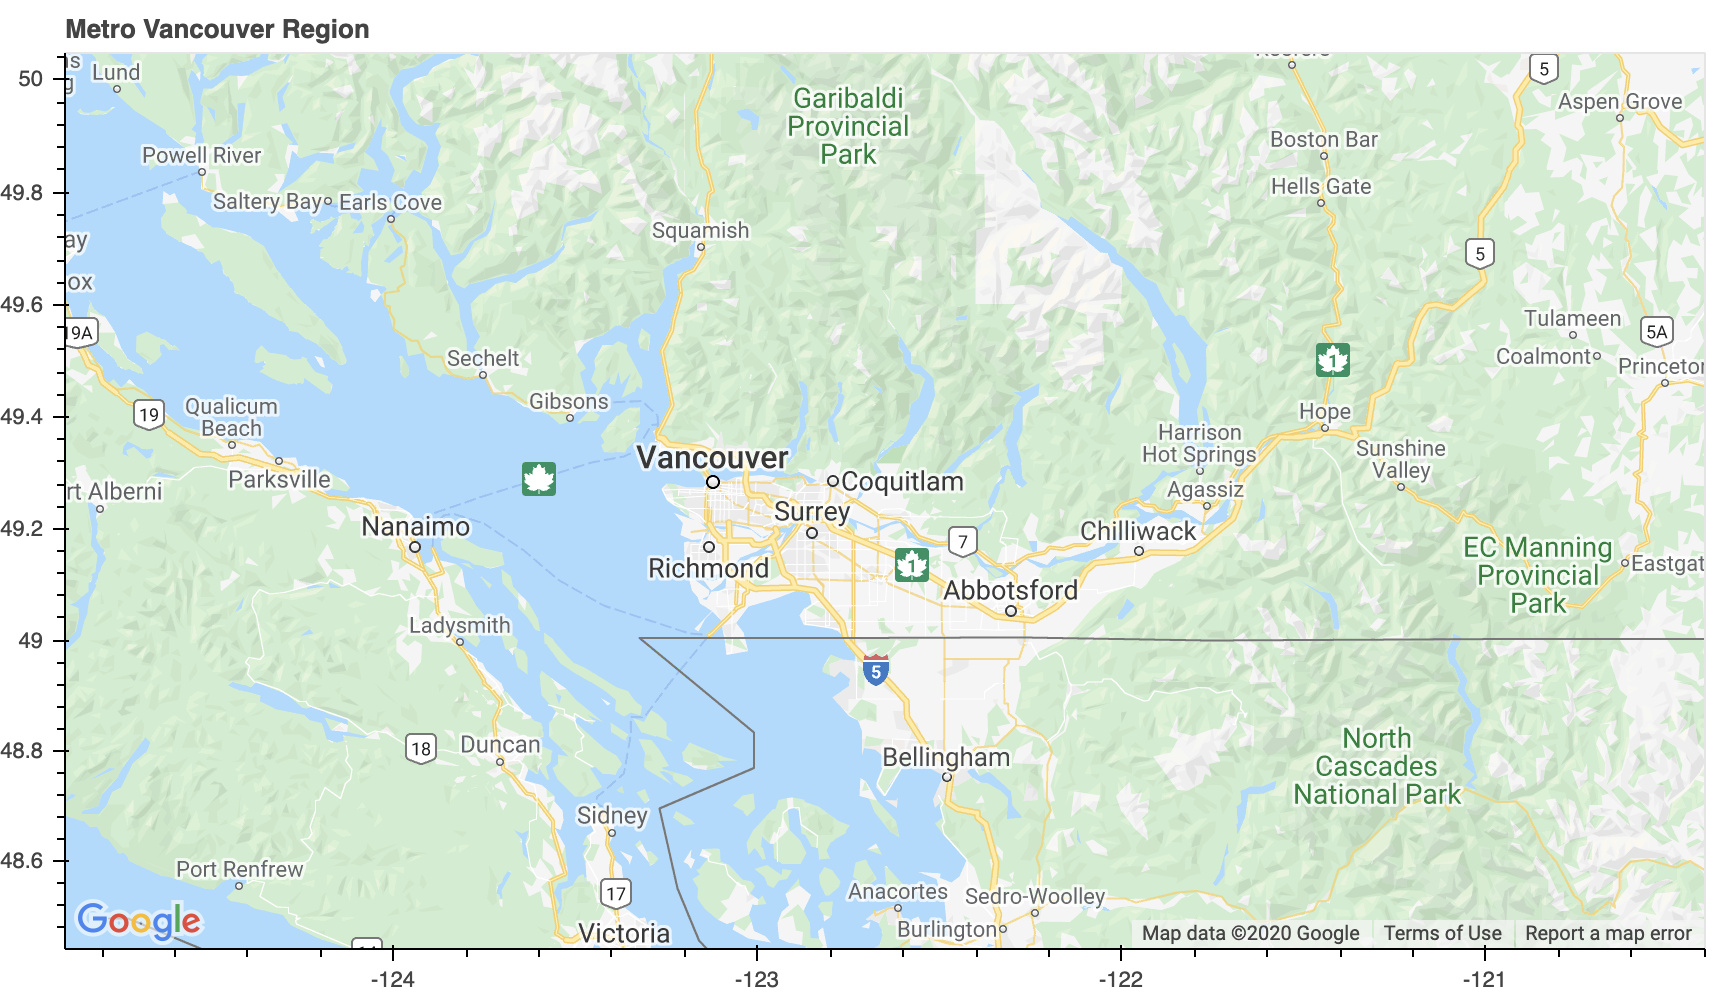
I have a project where I am trying to overlay some Geopandas generated polygons and multiploygons on a Google map tile of Vancouver.
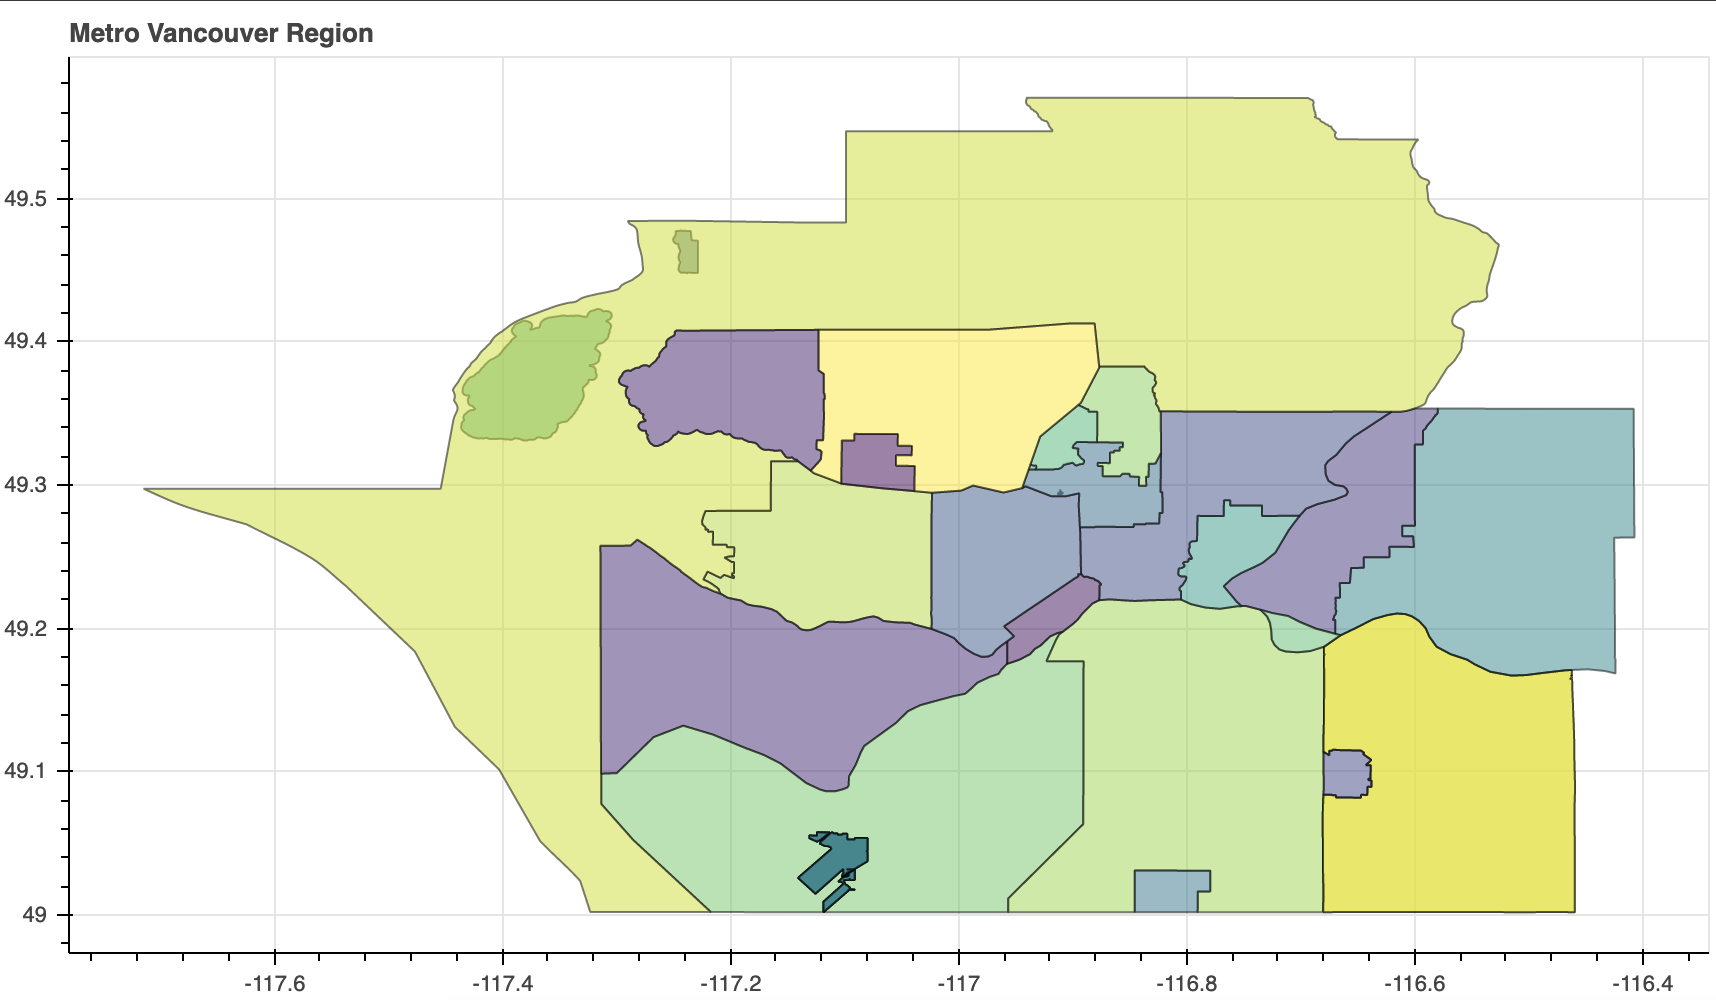
I’m using a Colab-hosted Juypter notebook with Python 3.6, Geopandas 0.8.1 and Bokeh 2.1.1. When I check boundaries.to_json()it outputs a JSON feature collection as expected. As one can see, I can plot each set of data individually, but when I try to apply thepatchesto thegmap` figure there is not plot generated. There is no error generated either which has been making it hard to troubleshoot and why I decided to take my problem here.
I seem to be misunderstanding how glyphs are attached to figure, but even looking at some of my old code and searching SO I haven’t been able to combine the data. Does anyone have any suggestions about what I need to change about my code so I can overlay the geojson polygons on the map?
from bokeh.plotting import figure, show, gmap
from bokeh.models import GMapOptions, GeoJSONDataSource
from bokeh.io import output_notebook
from bokeh.palettes import viridis

output_notebook()

boundaries = gpd.read_file(json_file_path)

# Bokeh Graphics
def renderGraphics(gdf_obj):
    # Set up
    map_options = GMapOptions(lat=49.25, lng=-122.65, map_type="roadmap", zoom=8)

    # Transform data to Bokeh source
    boundaries = process_dataframe_engine(gdf_obj)
    source = GeoJSONDataSource(geojson = boundaries.to_json())

    plot = gmap(api_key, map_options)
    #plot = figure() development
    plot.title.text = "Metro Vancouver Region"
    plot.plot_height = 500
    plot.plot_width = 860
    plot.toolbar_location = None

    plot.axis.visible = True
    plot.grid.visible = True

    plot.patches(
        "xs",
        "ys",
        fill_color = "color",
        source = source,
        line_color = "black",
        line_width = 1,
        alpha = 0.5
    )

    show(plot)

renderGraphics(boundaries)