I am creating a Vertical Bar based on my time records during the 2018.
I was creating a Vertical Bar
hover_2=HoverTool(tooltips=[('main activity','@main_activity'),('Count','@Count'),('Date','@Date{%F}')], formatters={
'Date' : 'datetime'})
plot=figure(title='Daily Hours',tools=[hover_2,'pan','wheel_zoom'],plot_width=400, plot_height=400,x_range=(xrange), y_range=(yrange))
plot.vbar(x="Date", top="Count",source=source, width=1000000)
What I have discovered that in a time span of 365 days (1Y)
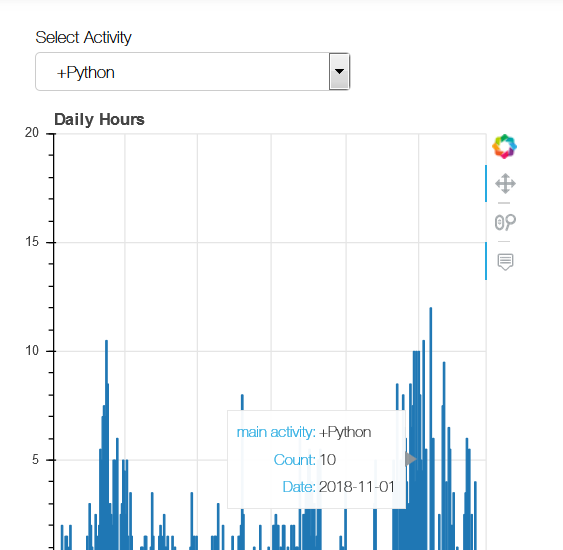
I can hover and get the required information only if the width is at least "1000000"
With Smaller Values I am not able to hover over the graph.
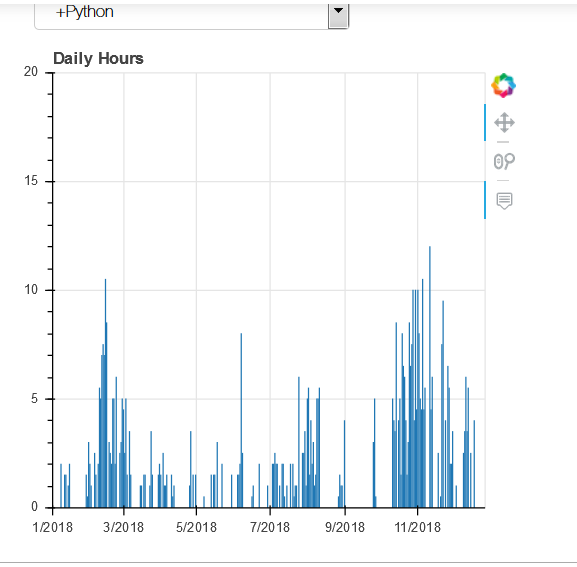
The first example is with a width value of 1.5.
<1.5.PNG>
The second example is with a width value of 1000000
<10000Python.PNG>
• Why this kind of behavior?
• How to know the minimal width?