Seems like a weird bug/corener case. Please feel free to file a GitHub issue with this information.
Thanks,
Bryan
···
On Jul 10, 2017, at 18:41, Alessandro Pocaterra <[email protected]> wrote:
Hi Brian.
I found by chance a trick to solve the issue:
AjaxDataSource(data=dict(x1=[1], y1=[1]), ...
The 1 added between [ and ] is enough to show the numbers immediately.
Thank you
Alex
On Jul 1, 2017 9:55 PM, "Bryan Van de ven" <[email protected]> wrote:
Hi,
The latest release fixed many layout-related bugs, but there is still work to do. I'm guessing this is a bug, perhaps related to this one:
I've not specifically encountered this situation with a standard plot, though. you might try increasing the value of "min_border" on the plot.
Thanks,
Bryan
> On Jun 23, 2017, at 02:44, Alessandro Pocaterra <[email protected]> wrote:
>
> I'm embedding a couple of streaming plots.
> Using Pythin 2.7 and Bokeh 0.12.6.
> I already checked HTML, I am loading bokehJS 0.12.6.
>
> The code is:
>
> p = figure()
> p.x_range.follow = "end"
> p.x_range.follow_interval = 10
> p.axis.visible = True
>
> source1 = AjaxDataSource(data=dict(x1=, y1=),
> data_url='http://127.0.0.1:5050/data/1',
> polling_interval=300)
>
> p.line(x='x1', y='y1', source=source1)
> script1, div1 = components(p)
>
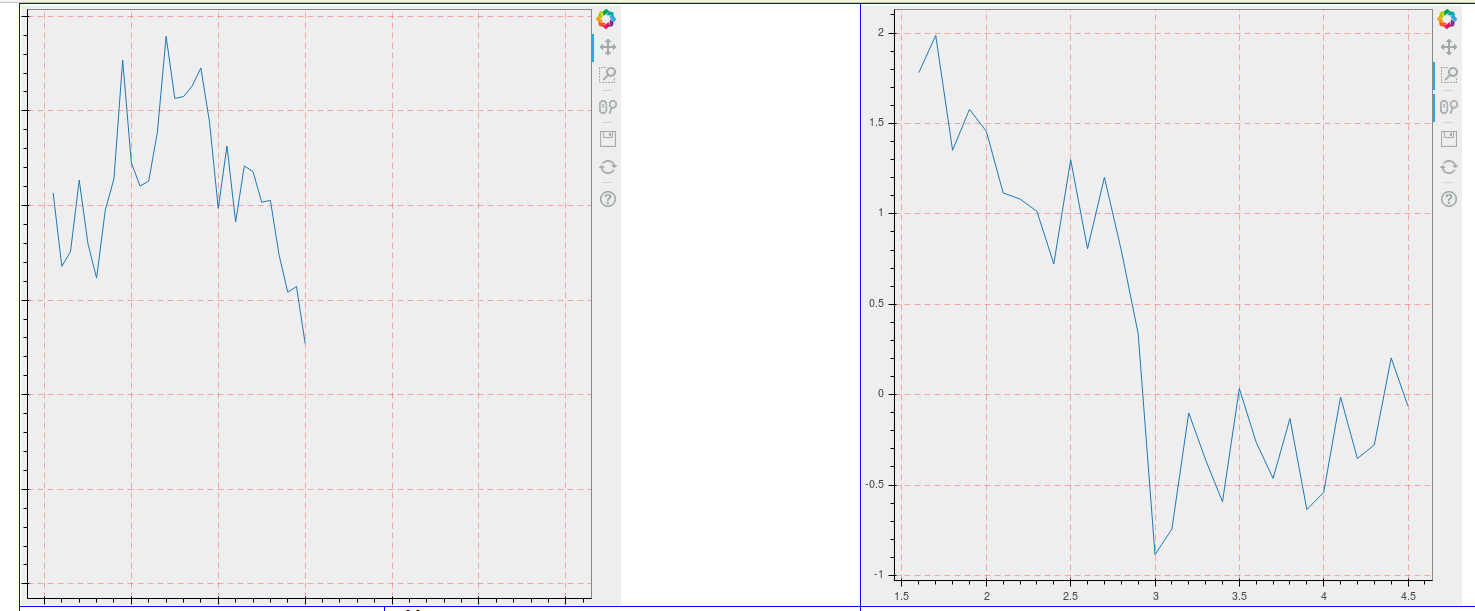
> Is there a reason why the scale numbers are not visible and then they become visible only after pressing Reset?
> Axis and ticks are always visible.
>
> In the image two plots: on the left as they are at start, on the right after pressing Reset.
>
> --