Models must be owned by only a single document

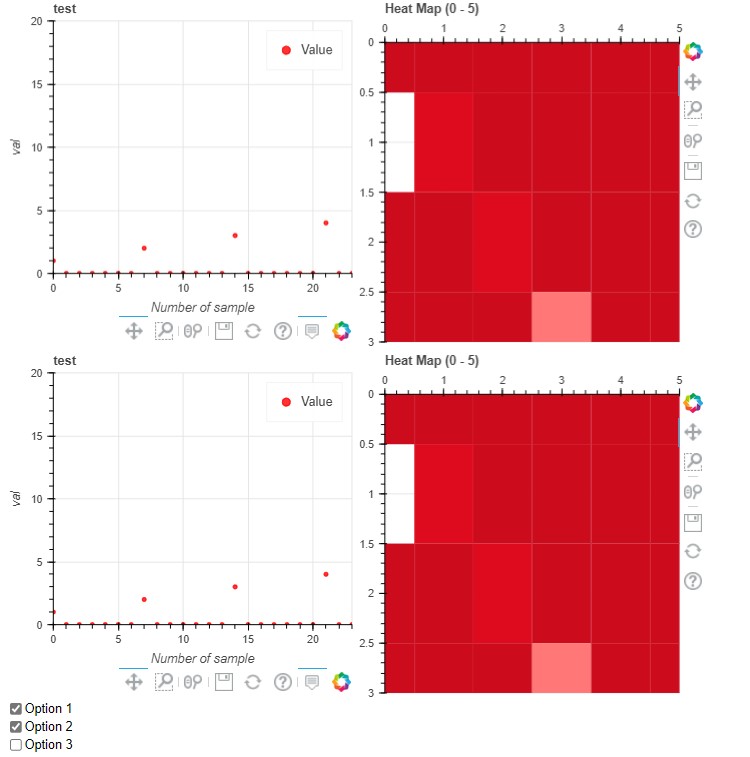
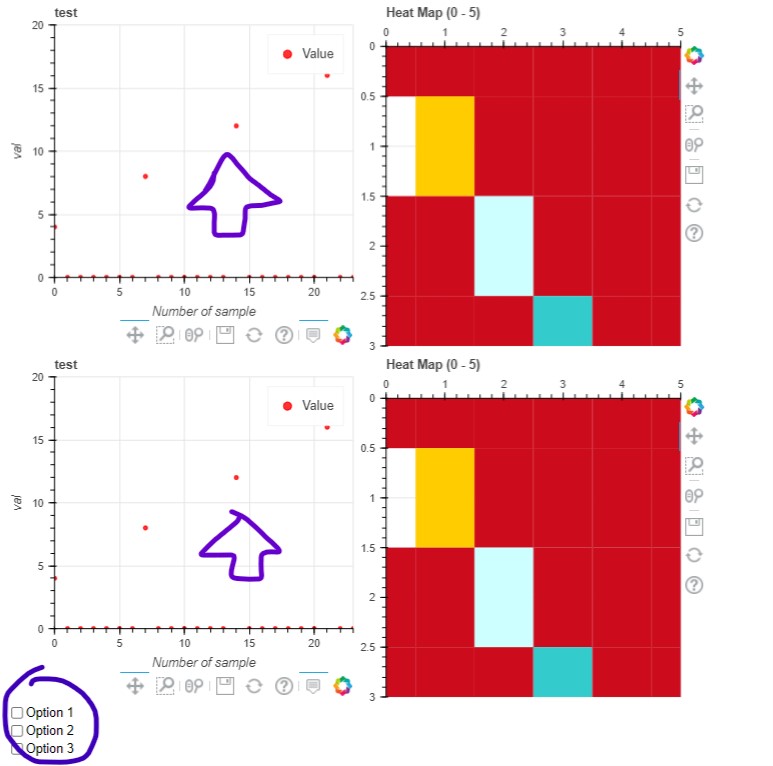
I use bokeh. and I want to change ColumnsDataSoruce in Custom JS when user push checkbox. But I write ““src_x = source_t”” in Custom JS. I met a error " Models must be owned by only a single document" . I want to solve this problem. Someone helps to me?

And I mention that I delete ““src_x = source_t”” in Custom JS, I hadn’t met error. But I need this ColmunsDataSource.

#====================== This is my code ====================================
import pandas as pd
from bokeh.plotting import ColumnDataSource, figure, output_file, show
from bokeh.models import CategoricalColorMapper, HoverTool, ColumnDataSource, Panel
from bokeh.models import CheckboxGroup, Slider, RangeSlider, Tabs , CustomJS
from bokeh.models import BasicTicker, ColorBar, LinearColorMapper, PrintfTickFormatter
from bokeh.embed import components

def plot_routine(val):

    s = [0,1,2,3,4,5,6,7,8,9,10,11,12,13,14,15,16,17,18,19,20,21,22,23]
    x = [0,1,2,3,4,5,0,1,2,3, 4, 5, 0, 1, 2, 3, 4, 5, 0, 1, 2, 3, 4, 5]
    y = [0,0,0,0,0,0,0,1,1,1, 1, 1, 2, 2, 2, 2, 2, 2, 3, 3, 3, 3, 3, 3]
    v = [1,0,0,0,0,0,0,2,0,0, 0, 0, 0, 0, 3, 0, 0, 0, 0, 0, 0, 4, 0, 0]
    df = pd.DataFrame(data=[s,x,y,v]).T
    df.columns=['s','x','y','v']   
    source_t = ColumnDataSource(df)  
    p1 , p2  = make_plot(source_t)
    
    LABELS = ["Option 1", "Option 2", "Option 3"]
    checkbox_group = CheckboxGroup(labels=LABELS, active=[0, 1])

    CheckBOXcallback = CustomJS(args=dict(src_x = source_t , check_sel=checkbox_group),
        code="""
        alert('Click Site Button')
     """)
    checkbox_group.js_on_change('active', CheckBOXcallback)
    # show(checkbox_group)    
    # CheckBOXcallback =[] 

    plots = {'Graph1': p1, 'Graph2': p2 , 'Check': CheckBOXcallback}

    return plots
#----------------------------------------------------------------------------------------#
#     Make Grpah Routine All Test                                                        #
#----------------------------------------------------------------------------------------#
def make_plot(source_temp):

    print ('20210823 : Make Grpah Routine All Test')
    plot1 = []
    plot2 = []

    #plot1,plot2  = make_plot_series(source_temp)
    
    for y in range(3):
        p1,p2  = make_plot_series(source_temp)
        plot1.append(p1)
        plot2.append(p2)

    return plot1,plot2
#----------------------------------------------------------------------------------------#
#      Make Grpah Routine Each Test                                                      #
#----------------------------------------------------------------------------------------#
def make_plot_series(src_t):
    temp_s = src_t.data['s']
    temp_s_list = temp_s.tolist()
    # Change Columns Data source to List and Re-Change List to Columns Data Source in order to use hover function
    temp_x = src_t.data['x']
    temp_x_list = temp_x.tolist()
    temp_y = src_t.data['y']
    temp_y_list = temp_y.tolist()
    temp_v = src_t.data['v']
    temp_v_list = temp_v.tolist()
    data_try = {'SD' : temp_s_list,
               'XD' : temp_x_list,
               'YD' : temp_y_list,
               'VD' : temp_v_list}
    source_try= ColumnDataSource(data= data_try)
    print ('20210823 : Make Grpah Routine Each Test\n')
    # ---------------------- Distribution Graph  ---------------------- 
    # Blank plot with correct labels
    p1 = figure(plot_width=360, plot_height=360, x_range=(min(src_t.data['s']),max(src_t.data['s'])), y_range=(min(src_t.data['v']),max(src_t.data['v'])) , 
        title='test' , x_axis_label='Number of sample', y_axis_label='val' , toolbar_location='below',)
    p1.scatter(x='SD' , y='VD' , source = source_try , marker='circle' , fill_color = 'red' , fill_alpha=0.8, color = 'red' ,
             legend_label = 'Value')
    
    # Hover tool with vline mode
    hoverdata = '@VD'
    hover = HoverTool(tooltips=[('sam', '@SD'), 
                                ('y', hoverdata),
                                ('Info-x', '@XD'),
                                ('info-y', '@YD')],
                        mode='vline')

    p1.add_tools(hover)       
    p1.legend.click_policy = 'hide'
    # show(p1)
    
    print ('20210823 : Finish Making Distribution Graph')
    # ---------------------- Heatmap Graph  ---------------------- 
    # this is the colormap from the original NYTimes plot
    colors = ["#000080","#0000FF","#33CCCC", "#99CCFF", "#CCFFFF", "#FFFF99", "#FFCC00", "#FF9900", "#FF7878", "#DD0b1d", "#CC0b1d"]
    mapper = LinearColorMapper(palette=colors, low=max(src_t.data['v']), high=min(src_t.data['v']))
    TOOLS = "hover,save,pan,box_zoom,reset,wheel_zoom"
    
    p2 = figure(title="Heat Map ({0} - {1})".format(min(src_t.data['x']), max(src_t.data['x'])),
               x_range=(min(src_t.data['x']),max(src_t.data['x'])), y_range=(max(src_t.data['y']),min(src_t.data['y'])), 
               x_axis_location="above", plot_width=360, plot_height=360)   
    p2.rect(x='x', y='y', width=1, height=1, source=src_t, fill_color={'field': 'v', 'transform': mapper}, line_color=None)   
    #show(p2)
    
    print ('20210824 : Finish Making Heat Map Graph : ')
    return p1,p2

ret_p = plot_routine('Start Graph Sample')

div=[]
div2=[]
div3=[]
script1, div = components(ret_p['Graph1'])
script2, div2 = components(ret_p['Graph2'])
script3, div3 = components(ret_p['Check'])
print (div,'\n',div2,'\n',div3)

====================== Error Message ====================================

RuntimeError Traceback (most recent call last)
in
109 script1, div = components(ret_p[‘Graph1’])
110 script2, div2 = components(ret_p[‘Graph2’])
→ 111 script3, div3 = components(ret_p[‘Check’])
112 print (div,’\n’,div2,’\n’,div3)

RuntimeError: Models must be owned by only a single document, ColumnDataSource(id=‘8901’, …) is already in a doc

Hi @kazux68k please edit your post to use code formatting so that the code is intelligible (either with the </> icon on the editing toolbar, or triple backtick ``` fences around the code blocks).

Additionally, please pare away all the code that is unrelated to reproducing just the problem at hand, i.e. provide a complete Minimal Reproducible Example.

import pandas as pd
from bokeh.plotting import ColumnDataSource, figure, output_file, show
from bokeh.models import CategoricalColorMapper, HoverTool, ColumnDataSource, Panel
from bokeh.models import CheckboxGroup, Slider, RangeSlider, Tabs , CustomJS
from bokeh.models import BasicTicker, ColorBar, LinearColorMapper, PrintfTickFormatter
from bokeh.embed import components

def plot_routine(val):

    s = [0,1,2,3,4,5,6,7,8,9,10,11,12,13,14,15,16,17,18,19,20,21,22,23]
    x = [0,1,2,3,4,5,0,1,2,3, 4, 5, 0, 1, 2, 3, 4, 5, 0, 1, 2, 3, 4, 5]
    y = [0,0,0,0,0,0,0,1,1,1, 1, 1, 2, 2, 2, 2, 2, 2, 3, 3, 3, 3, 3, 3]
    v = [1,0,0,0,0,0,0,2,0,0, 0, 0, 0, 0, 3, 0, 0, 0, 0, 0, 0, 4, 0, 0]
    df = pd.DataFrame(data=[s,x,y,v]).T
    df.columns=['s','x','y','v']   
    source_t = ColumnDataSource(df)  
    p1 , p2  = make_plot(source_t)
    
    LABELS = ["Option 1", "Option 2", "Option 3"]
    checkbox_group = CheckboxGroup(labels=LABELS, active=[0, 1])

    CheckBOXcallback = CustomJS(args=dict(src_x = source_t , check_sel=checkbox_group),
        code="""
        alert('Click Site Button')
     """)
    checkbox_group.js_on_change('active', CheckBOXcallback)
    # show(checkbox_group)    
    # CheckBOXcallback =[] 

    plots = {'Graph1': p1, 'Graph2': p2 , 'Check': CheckBOXcallback}

    return plots
#----------------------------------------------------------------------------------------#
#     Make Grpah Routine All Test                                                        #
#----------------------------------------------------------------------------------------#
def make_plot(source_temp):

    print ('20210823 : Make Grpah Routine All Test')
    plot1 = []
    plot2 = []

    #plot1,plot2  = make_plot_series(source_temp)
    
    for y in range(3):
        p1,p2  = make_plot_series(source_temp)
        plot1.append(p1)
        plot2.append(p2)

    return plot1,plot2
#----------------------------------------------------------------------------------------#
#      Make Grpah Routine Each Test                                                      #
#----------------------------------------------------------------------------------------#
def make_plot_series(src_t):
    temp_s = src_t.data['s']
    temp_s_list = temp_s.tolist()
    # Change Columns Data source to List and Re-Change List to Columns Data Source in order to use hover function
    temp_x = src_t.data['x']
    temp_x_list = temp_x.tolist()
    temp_y = src_t.data['y']
    temp_y_list = temp_y.tolist()
    temp_v = src_t.data['v']
    temp_v_list = temp_v.tolist()
    data_try = {'SD' : temp_s_list,
               'XD' : temp_x_list,
               'YD' : temp_y_list,
               'VD' : temp_v_list}
    source_try= ColumnDataSource(data= data_try)
    print ('20210823 : Make Grpah Routine Each Test\n')
    # ---------------------- Distribution Graph  ---------------------- 
    # Blank plot with correct labels
    p1 = figure(plot_width=360, plot_height=360, x_range=(min(src_t.data['s']),max(src_t.data['s'])), y_range=(min(src_t.data['v']),max(src_t.data['v'])) , 
        title='test' , x_axis_label='Number of sample', y_axis_label='val' , toolbar_location='below',)
    p1.scatter(x='SD' , y='VD' , source = source_try , marker='circle' , fill_color = 'red' , fill_alpha=0.8, color = 'red' ,
             legend_label = 'Value')
    
    # Hover tool with vline mode
    hoverdata = '@VD'
    hover = HoverTool(tooltips=[('sam', '@SD'), 
                                ('y', hoverdata),
                                ('Info-x', '@XD'),
                                ('info-y', '@YD')],
                        mode='vline')

    p1.add_tools(hover)       
    p1.legend.click_policy = 'hide'
    # show(p1)
    
    print ('20210823 : Finish Making Distribution Graph')
    # ---------------------- Heatmap Graph  ---------------------- 
    # this is the colormap from the original NYTimes plot
    colors = ["#000080","#0000FF","#33CCCC", "#99CCFF", "#CCFFFF", "#FFFF99", "#FFCC00", "#FF9900", "#FF7878", "#DD0b1d", "#CC0b1d"]
    mapper = LinearColorMapper(palette=colors, low=max(src_t.data['v']), high=min(src_t.data['v']))
    TOOLS = "hover,save,pan,box_zoom,reset,wheel_zoom"
    
    p2 = figure(title="Heat Map ({0} - {1})".format(min(src_t.data['x']), max(src_t.data['x'])),
               x_range=(min(src_t.data['x']),max(src_t.data['x'])), y_range=(max(src_t.data['y']),min(src_t.data['y'])), 
               x_axis_location="above", plot_width=360, plot_height=360)   
    p2.rect(x='x', y='y', width=1, height=1, source=src_t, fill_color={'field': 'v', 'transform': mapper}, line_color=None)   
    #show(p2)
    
    print ('20210824 : Finish Making Heat Map Graph : ')
    return p1,p2

ret_p = plot_routine('Start Graph Sample')

div=[]
div2=[]
div3=[]
script1, div = components(ret_p['Graph1'])
script2, div2 = components(ret_p['Graph2'])
script3, div3 = components(ret_p['Check'])
print (div,'\n',div2,'\n',div3)

Hi @Bryan Thanks for quick reply. I use </> . please confirm about it?
And I will check Minimal Reproducible Example.

  • My Problem
    I can’t get components ret_p[‘check’] only . But I modify from [1] to [2] . I can get it.

[1] I can’t get components

    CheckBOXcallback = CustomJS(args=dict(src_x = source_t , check_sel=checkbox_group),
        code="""
        alert('Click Site Button')
     """)

[2] I can get components [ delete src_x = source_t ]

    CheckBOXcallback = CustomJS(args=dict( check_sel=checkbox_group),
        code="""
        alert('Click Site Button')
     """)

But I need src_x = source_t in my code. I want to change ColumnsDataSource source_t in this CustomJS. Could you help me?

Hi @kazux68k ,

The problem here is that your multiple calls to components produces multiple documents, and multiple documents cannot share a ColumnDataSource. Your p2 plots and the CheckBOXcallback both use source_t, so that won’t work.

You can make a single call to components, but you will need to provide the arguments either as a list of models or a dict of strings-to-models. (This means just passing a list of [p1, p2, CheckBOXcallback] won’t work, because p1 and p2 are lists and not Bokeh models.) You could pass the individual plots of p1 and p2, or possibly use a row or column to contain those plots and pass those models to components.

1 Like

Also note that there is no reason I can think of to ever pass a callback, e.g. CheckBOXcallback to the components function. Presumably you mean to pass the widget, checkbox_group? Generally speaking, the only things that are passed directly to components are things that will be displayed.

1 Like

2021-09-01T15:00:00Z
Hi @carolyn . Thanks for your help. I changed my program to use from multi-documents to one-document to follow your advice. And I merged my component scatter(p1) and heatmap(p2) and checkbox_group. And then I finally can use source_t in my CheckBOXcallback. please refer attached file before and after. I clicked CheckBOX , source_t value changed.

####Before pushing CheckBOX####


####After pushing CheckBOX####

And My code.

import pandas as pd
from bokeh.plotting import ColumnDataSource, figure, output_file, show
from bokeh.models import CategoricalColorMapper, HoverTool, ColumnDataSource, Panel
from bokeh.models import CheckboxGroup, Slider, RangeSlider, Tabs , CustomJS
from bokeh.models import BasicTicker, ColorBar, LinearColorMapper, PrintfTickFormatter
from bokeh.embed import components

#20210902 add
from bokeh.layouts import row, column

def plot_routine(val):

    s = [0,1,2,3,4,5,6,7,8,9,10,11,12,13,14,15,16,17,18,19,20,21,22,23]
    x = [0,1,2,3,4,5,0,1,2,3, 4, 5, 0, 1, 2, 3, 4, 5, 0, 1, 2, 3, 4, 5]
    y = [0,0,0,0,0,0,0,1,1,1, 1, 1, 2, 2, 2, 2, 2, 2, 3, 3, 3, 3, 3, 3]
    v = [1,0,0,0,0,0,0,2,0,0, 0, 0, 0, 0, 3, 0, 0, 0, 0, 0, 0, 4, 0, 0]
    df = pd.DataFrame(data=[s,x,y,v]).T
    df.columns=['s','x','y','v']   
    source_t = ColumnDataSource(df)  
    p1 , p2  = make_plot(source_t)
    
    LABELS = ["Option 1", "Option 2", "Option 3"]
    checkbox_group = CheckboxGroup(labels=LABELS, active=[0, 1])

    CheckBOXcallback = CustomJS(args=dict( src_x = source_t ,check_sel=checkbox_group),
        code="""
        let ori_src  = src_x.data;
        
        alert('Click Site Button')
        let ori_s = ori_src['s'];
        let ori_x = ori_src['x'];
        let ori_y = ori_src['y'];
        let ori_v = ori_src['v'];
        alert('Debug 01') 
        // Initialize data
        let new_s=[];
        let new_x=[];
        let new_y=[];
        let new_v=[];
        alert('Debug 02')
        // setting data
        new_s=ori_s;
        new_x=ori_x;
        new_y=ori_y;
        // データのコピー(for文なので何か良い方法が欲しい)
        for (let i = 0; i < ori_v.length; i++){
            new_v[i] = parseFloat(ori_v[i])*2;
        }
        alert('Finish Setting Data' + new_v )  
        // reflect data
        src_x.data['s']=new_s;
        src_x.data['x']=new_x;
        src_x.data['y']=new_y;
        src_x.data['v']=new_v;
        
        src_x.change.emit();          
        
     """)
    checkbox_group.js_on_change('active', CheckBOXcallback)
    # show(checkbox_group)    
    # CheckBOXcallback =[] 
    
    p1 = row(p1,p2)
    p1 = column(p1,checkbox_group)
    show(p1)
    
    plots = {'Graph1': p1}
    
    # plots = {'Graph1': p1, 'Graph2': p2 , 'Check': CheckBOXcallback}

    return plots
#----------------------------------------------------------------------------------------#
#     Make Grpah Routine All Test                                                        #
#----------------------------------------------------------------------------------------#
def make_plot(source_temp):

    print ('20210823 : Make Grpah Routine All Test')
    #plot1 = []
    #plot2 = []

    #plot1,plot2  = make_plot_series(source_temp)
    
    for y in range(3):
        p1,p2  = make_plot_series(source_temp)
        if y != 0 :
            plot1 = column(plot1,p1)
            plot2 = column(plot2,p2)
        else :
            plot1 = p1
            plot2 = p2
        #plot2.append(p2)

    return plot1,plot2
#----------------------------------------------------------------------------------------#
#      Make Grpah Routine Each Test                                                      #
#----------------------------------------------------------------------------------------#
def make_plot_series(src_t):
    # ---------------------- Distribution Graph  ---------------------- 
    # Blank plot with correct labels
    p1 = figure(plot_width=360, plot_height=360, x_range=(min(src_t.data['s']),max(src_t.data['s'])), y_range=(min(src_t.data['v']),max(src_t.data['v'])*5) , 
        title='test' , x_axis_label='Number of sample', y_axis_label='val' , toolbar_location='below',)
    p1.scatter(x='s' , y='v' , source = src_t , marker='circle' , fill_color = 'red' , fill_alpha=0.8, color = 'red' ,
             legend_label = 'Value')
    
    # Hover tool with vline mode
    hoverdata = '@v'
    hover = HoverTool(tooltips=[('sam', '@s'), 
                                ('y', hoverdata),
                                ('Info-x', '@x'),
                                ('info-y', '@y')],
                        mode='vline')

    p1.add_tools(hover)       
    p1.legend.click_policy = 'hide'
    # show(p1)
    
    print ('20210823 : Finish Making Distribution Graph')
    # ---------------------- Heatmap Graph  ---------------------- 
    # this is the colormap from the original NYTimes plot
    colors = ["#000080","#0000FF","#33CCCC", "#99CCFF", "#CCFFFF", "#FFFF99", "#FFCC00", "#FF9900", "#FF7878", "#DD0b1d", "#CC0b1d"]
    mapper = LinearColorMapper(palette=colors, low=(max(src_t.data['v'])*5), high=min(src_t.data['v']))
    TOOLS = "hover,save,pan,box_zoom,reset,wheel_zoom"
    
    p2 = figure(title="Heat Map ({0} - {1})".format(min(src_t.data['x']), max(src_t.data['x'])),
               x_range=(min(src_t.data['x']),max(src_t.data['x'])), y_range=(max(src_t.data['y']),min(src_t.data['y'])), 
               x_axis_location="above", plot_width=360, plot_height=360)   
    p2.rect(x='x', y='y', width=1, height=1, source=src_t, fill_color={'field': 'v', 'transform': mapper}, line_color=None)   
    #show(p2)
    
    print ('20210824 : Finish Making Heat Map Graph : ')
    return p1,p2

ret_p = plot_routine('Start Graph Sample')

div=[]
div2=[]
div3=[]
script1, div = components(ret_p)
#script2, div2 = components(ret_p['Graph2'])
#script3, div3 = components(ret_p['Check'])
print (div,'\n',div2,'\n',div3)

It works that I think . Thanks a lot.

1 Like

Hi @Bryan , Thanks for your help. Yeah I want to make widget and I call it from HTML file through the Django. So I want to get ‘div’ . Now I packed three figure ( 2plots and 1Check BOX). I works that I think. I appreciate you. thanks.

1 Like

This topic was automatically closed 90 days after the last reply. New replies are no longer allowed.