How can I change y ticks depending on may x and y data?
for example I have 2 line plots. the first plot’s y all containing 0 value, and other plot(2nd plot) containing 7 to 8(probably with decimal value such as 7.1,7.8, 7.15 etc). what i want is on the second plot I want to show the curve of plot, and remove the unused tick 1 thru 6 see example image above,
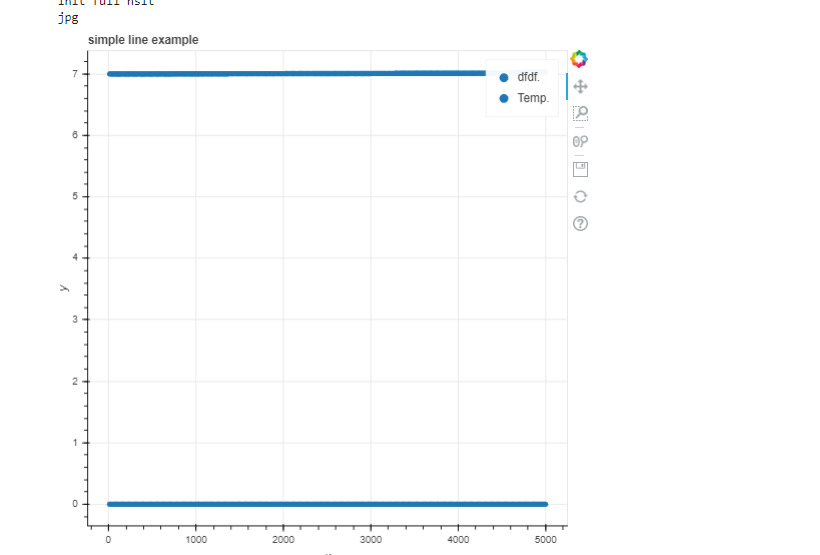
It should be 0 then 7 no more 1 to 6